lindosskier
Member
Hi @SleepyZ, @tomsk, @BenTen ,
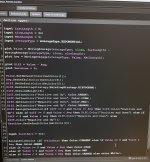
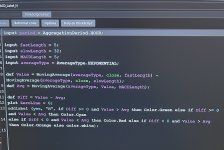
Can you please tell me what I’m doing wrong here?
I have this code painting my candles based on the MACD being above/below zero and also if the Value is above/below Avg (NOT JUST HIGHER/LOWER from the previous bar, but in relation to the Avg line), as you can see from the pic.
But when I try to use it, to create labels which will allow me to see what colors the candles are on higher timeframes (so when I’m on the 5min chart, I’d like to be able to see what colors are the bars on the 15min, 1H, 4H, 1D, 1W etc via colored labels on the top left) it doesn’t pain the correct labels. Can you please help me? Spent countless hours on this and cannot seem to know what’s wrong.
Thank you in advance for your help and have a great New Year.
Attachments
Last edited by a moderator:


