Code error Folding: Integer 'from' is expected. NaN - seek help to fix

Viva_B

New member
iUWPKKD.png

Hi Everyone,

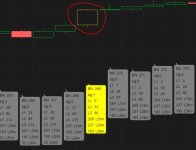
I seek help to fix a code. I am trying to find fresh demand and supply zones for forex trading. I have used some code from community members(and I really already appreciate the help and support) to find candles on the chart going 300 bars back from last closed candle to find legout candles(orange candles) of demand and supply zones. I record candle numbers of the last 3 zones within +/- 2% of the current price. I then try to go from last closed candle to the 1st legout candle(orange).

If this originally a red candle ( open > close) then i check for highs of all candles starting from the current price to see if any high is above the open of this red candle. If this is the case the FOLD loop is exited and we know this is not a fresh zone.

If 1st orange candle is originally a green candle(close>open) then i check for lows of all candles starting from the current price to see if any low is below the open of this green candle. If this is the case the FOLD loop is exited and we know this is not a fresh zone.

I want to put an arrow under/above the legout candle of a fresh zone for the orange candles in the 1st 300 candles from the 1st closed candle.

I get L1 ( 1st orange candle) bar number right but then it seems the cold finds a nan and gives random results for L2 and L3. It also shows "Folding: Integer 'from' is expected. "

Code is attached. Seek help of members to guide me in the right direction to fix this code.

Thanks in advance!
gt91j5P.png

Code:
# // Find a supply/demand zone of high quality
input Sensitivity = 2.25;
def Candle_Range = high - low;
def Body_Range = AbsValue(close - open);
def Bar_Lookback = 100;
def Volatility = ATR(Bar_Lookback);
def Strength = Volatility * Sensitivity;
def Exciting = (Body_Range > Candle_Range * 0.75) and (Candle_Range >= Strength);


def C = Exciting;
#def A = Exciting2 and lunch;
#def B = Exciting2 and lunch[5];

# // Assign color orange to legout of the demand/supply zone
AssignPriceColor(if C then Color.ORANGE else Color.CURRENT);

#def lastBar = if IsNaN(close[-1])  && !IsNaN(close) then BarNumber() else lastBar[1];

#// Go back 300 candles from last bar on chart to find the 1st legout candle(orange candle) of demand/supply zone
def L1 = fold k = 1 to 300 with CValue = 0 while CValue <= 0 do
 if AbsValue (getvalue(close,k) - getvalue(open,k)) > ((getvalue(high,k) - getvalue(low,k)) * .75) and ((getvalue(high,k) - getvalue(low,k)) >= ATR(Bar_Lookback) * 2.25) then CValue + k else CValue ;

#// Go back 300 candles from 1st orange candle to next orange candle on chart to find the 2nd orange candle
def L2 = fold j = L1+1 to 300 with CValue2 = 0 while  Cvalue2 <=0 do
    if AbsValue (getvalue(close,j) - getvalue(open,j)) > ((getvalue(high,j) - getvalue(low,j)) * .75) and ((getvalue(high,j) - getvalue(low,j)) >= ATR(Bar_Lookback) * 2.25) then CValue2 + j else CValue2 ;

#// Go back 300 candles from 2nd orange candle to next orange candle on chart to find the 3rd orange candle

def L3 = fold m = L2+1 to 300 with CValue3 = 0 while CValue3 <= 0  do
    if AbsValue (getvalue(close,m) - getvalue(open,m)) > ((getvalue(high,m) - getvalue(low,m)) * .75) and ((getvalue(high,m) - getvalue(low,m)) >= ATR(Bar_Lookback) * 2.25) then CValue3 + m else CValue3 ;


#// check if 1st orange candle is within 2% of current price and is red candle (open> close)
 def L1_Red_Candle_Check = if GetValue(close, L1) < GetValue(close, 1) * 1.02 and GetValue(close, L1) > GetValue(close, 1) * 0.8 and GetValue(open, L1) >= GetValue(close, L1) then 1 else 0;

#// check if highs of all candles from current price to 1st orange candle are below the close of the 1st orange candle. If yes come out of the loop. This shows the supply zone is not fresh and price has cut it at least once
def L1_Fresh_Above = fold n = 1 to 200 with Highvalue = 0 while L1_Red_Candle_Check and
Highvalue<=0 do
if (n < L1 and GetValue(high, n) > GetValue(open, L1)) then Highvalue + n else Highvalue;

#// check if 1st orange candle is within 2% of current price and is green candle (close > open)
def L1_Green_Candle_Check = if GetValue(close, L1) < GetValue(close, 1) * 1.02 and GetValue(close, L1) > GetValue(close, 1) * 0.8 and GetValue(open, L1) < GetValue(close, L1) then 1 else 0;

#// check if lows of all candles from current price to 1st orange candle are above the open price of the 1st orange candle. If yes come out of the loop. This shows the demand zone is not fresh and price has cut it at least once

def L1_Fresh_Below = fold s = 1 to 200 with Lowvalue = 0 while L1_Green_Candle_Check and Lowvalue<=0 do
if (s < L1 and GetValue(low, s)  < GetValue(open, L1)) then Lowvalue + s else Lowvalue;

def L2_Red_Candle_Check = if GetValue(close, L2) < GetValue(close, 1) * 1.02 and GetValue(close, L2) > GetValue(close, 1) * 0.8 and GetValue(open, L2) >= GetValue(close, L2) then 1 else 0;

def L2_Fresh_Above = fold t = 1 to 200 with Highvalue2 = 0 while L2_Red_Candle_Check and Highvalue2<=0 do
if (t < L2 and GetValue(high, t) > GetValue(open, L2)) then Highvalue2 + t else Highvalue2;

def L2_Green_Candle_Check = if GetValue(close, L2) < GetValue(close, 1) * 1.02 and GetValue(close, L2) > GetValue(close, 1)* 0.8 and GetValue(open, L2) < GetValue(close, L2) then 1 else 0;

def L2_Fresh_Below = fold u = 1 to 200 with Lowvalue2 = 0 while L2_Green_Candle_Check and Lowvalue2<=0 do
if (u < L2 and GetValue(low, u) < GetValue(open, L2)) then Lowvalue2 + u else Lowvalue2;


#def L1_Fresh_Above = fold n = 1 to 200 with Highvalue = 0 while n < L1 do
#if (getvalue(close, L1) < close[1]*1.02 and getvalue(close, L1) > close[1]*.08 and high[n] #> getvalue(open, L1)) then HighValue + n else HighValue;

AddLabel(1,  " L1 " + L1 + " L2 " + L2 + " L3 " + L3 + " L1_Fresh_Above " + L1_Fresh_Above + " L1_Fresh_Below " + L1_Fresh_Below + " L2_Fresh_Above " + L2_Fresh_Above + " L2_Fresh_Below " + L2_Fresh_Below);
 
Last edited by a moderator:
Solution
not sure yet

i added this to display some vars and to test for numbers with a fractional part
but i dont see any colored bubbles.

the error lists 2.25 as a value somewhere, but i dont see it.
often, tos error codes are wrong and can lead one in the wrong direction

next, will disable all code lines, then enable 1 at a time, to see when error pops up


Code:
addchartbubble(1,low,
l1 + "\n" +
l2 + "\n" +
l3 + "\n" +
 L1_Fresh_Above + " L1_Fresh_Above \n" +
 L1_Fresh_Below + " L1_Fresh_Below \n" +
 L2_Fresh_Above + " L2_Fresh_Above \n" +
 L2_Fresh_Below + " L2_Fresh_Below \n"
, (if isnan(l1) then color.yellow else if isnan(l2) then color.magenta else
 if floor(l1)!=l1 then color.cyan else if floor(l2)!=l2 then color.blue
 else...
not sure yet

i added this to display some vars and to test for numbers with a fractional part
but i dont see any colored bubbles.

the error lists 2.25 as a value somewhere, but i dont see it.
often, tos error codes are wrong and can lead one in the wrong direction

next, will disable all code lines, then enable 1 at a time, to see when error pops up


Code:
addchartbubble(1,low,
l1 + "\n" +
l2 + "\n" +
l3 + "\n" +
 L1_Fresh_Above + " L1_Fresh_Above \n" +
 L1_Fresh_Below + " L1_Fresh_Below \n" +
 L2_Fresh_Above + " L2_Fresh_Above \n" +
 L2_Fresh_Below + " L2_Fresh_Below \n"
, (if isnan(l1) then color.yellow else if isnan(l2) then color.magenta else
 if floor(l1)!=l1 then color.cyan else if floor(l2)!=l2 then color.blue
 else color.gray), no);

==========================

something odd with L2 formula
without the label or bubble, no error. with , then error pops up.

will look at later

=====================

i would take all those getvalues out of loops.
make a formula to check for the condition , and save the barnumber. then in the loops, look for that barnumber ( or a 1...)

=================

the fold loops , from and to , vars are wrong.
you are adding L1+ and L2+ to the 'from' var, but not to the 300
 
Last edited:
Solution

Join useThinkScript to post your question to a community of 21,000+ developers and traders.

here is the first half , not complete
i have the L1,L2,L3 loops almost working.

loops don't stop when it gets to the first barnumber, and returns wrong numbers.
counting from barnumber 1, and going to the right
.. on the the 1st signal, L2 and L3 will be wrong
.. on the the 2nd signal, L3 will be wrong
.. on the the 3rd signal, L1,L2,L3 should be ok

bubbles show values

Code:
#supply_demand_loops_00d_aaa

#https://usethinkscript.com/threads/code-error-folding-integer-from-is-expected-nan-seek-help-to-fix.20945/

def na = double.nan;
def bn = barnumber();

# // Find a supply/demand zone of high quality
input Sensitivity = 2.25;
def Candle_Range = high - low;
def Body_Range = AbsValue(close - open);
def Bar_Lookback = 100;
def Volatility = ATR(Bar_Lookback);
def Strength = Volatility * Sensitivity;
def Exciting = (Body_Range > Candle_Range * 0.75) and (Candle_Range >= Strength);

def C = Exciting;
#def A = Exciting2 and lunch;
#def B = Exciting2 and lunch[5];

# // Assign color orange to legout of the demand/supply zone
AssignPriceColor(if C then Color.ORANGE else Color.CURRENT);

#def lastBar = if IsNaN(close[-1])  && !IsNaN(close) then BarNumber() else lastBar[1];

def hilo_factor = 0.75;
def atr_factor = 2.25;
def n1 = 300;

# make a formula for the signal, legout candle
def a = if AbsValue(close - open) > ((high - low) * hilo_factor) and ((high - low) >= ATR(Bar_Lookback) * atr_factor) then 1 else 0;


#// Go back 300 candles from last bar on chart to find the 1st legout candle(orange candle) of demand/supply zone
def L1 = fold e = 0 to n1
 with CValue1
 while getvalue(a,e) == 0 and !isnan(getvalue(close,e))
 do cvalue1 + 1;

#// Go back 300 candles from 1st orange candle to next orange candle on chart to find the 2nd orange candle
def L2 = fold f = 0 to n1
 with CValue2 = L1+1
 while getvalue(a,(L1+f+1)) == 0 and !isnan(getvalue(close,(L1+f+1)))
 do cvalue2 + 1;

#// Go back 300 candles from 2nd orange candle to next orange candle on chart to find the 3rd orange candle
def L3 = fold g = 0 to n1
 with CValue3 = L2+L1+1
 while getvalue(a,(L2+L1+g+1)) == 0 and !isnan(getvalue(close,(L2+L1+g+1)))
 do cvalue3 + 1;


addchartbubble(1, low*0.95,
"BN  " + bn + "\n" +
"sig " + a + "\n" +
"L1   " + l1 + "\n" +
"L2   " + l2 + "\n" +
"L3   " + l3 + "\n" +
getvalue(bn,l1)  + "  L1bn\n" +
getvalue(bn,l2)  + "  L2bn\n" +
getvalue(bn,l3)  + "  L3bn\n" 
# L1_Fresh_Above + " L1_Fresh_Above \n" +
# L1_Fresh_Below + " L1_Fresh_Below \n" +
# L2_Fresh_Above + " L2_Fresh_Above \n" +
# L2_Fresh_Below + " L2_Fresh_Below \n"
, (if a then color.yellow else color.gray), no);
#, (if isnan(l1) then color.yellow else if isnan(l2) then color.magenta else 
# if floor(l1)!=l1 then color.cyan else if floor(l2)!=l2 then color.blue
# else color.gray), no);
#
 

Attachments

  • img-00c-2.JPG
    img-00c-2.JPG
    56 KB · Views: 4

Similar threads

Not the exact question you're looking for?

Start a new thread and receive assistance from our community.

87k+ Posts
304 Online
Create Post

Similar threads

Similar threads

The Market Trading Game Changer

Join 2,500+ subscribers inside the useThinkScript VIP Membership Club
  • Exclusive indicators
  • Proven strategies & setups
  • Private Discord community
  • ‘Buy The Dip’ signal alerts
  • Exclusive members-only content
  • Add-ons and resources
  • 1 full year of unlimited support

Frequently Asked Questions

What is useThinkScript?

useThinkScript is the #1 community of stock market investors using indicators and other tools to power their trading strategies. Traders of all skill levels use our forums to learn about scripting and indicators, help each other, and discover new ways to gain an edge in the markets.

How do I get started?

We get it. Our forum can be intimidating, if not overwhelming. With thousands of topics, tens of thousands of posts, our community has created an incredibly deep knowledge base for stock traders. No one can ever exhaust every resource provided on our site.

If you are new, or just looking for guidance, here are some helpful links to get you started.

What are the benefits of VIP Membership?
VIP members get exclusive access to these proven and tested premium indicators: Buy the Dip, Advanced Market Moves 2.0, Take Profit, and Volatility Trading Range. In addition, VIP members get access to over 50 VIP-only custom indicators, add-ons, and strategies, private VIP-only forums, private Discord channel to discuss trades and strategies in real-time, customer support, trade alerts, and much more. Learn all about VIP membership here.
How can I access the premium indicators?
To access the premium indicators, which are plug and play ready, sign up for VIP membership here.
Back
Top