# chg_of2_bars
def bn = BarNumber();
def na = Double.NaN;
#def daytime3 = (gettime() >= RegularTradingStart(GetYYYYMMDD()) and gettime() < RegularTradingend(GetYYYYMMDD()));
#def difftime = daytime3 != daytime3[1];
#def timefirst = daytime3 and !daytime3[1];
#def timelast = daytime3 and !daytime3[-1];
def diffday = GetDay() != GetDay()[1];
#def lastday = GetDay() != GetlastDay();
# times , (EST)
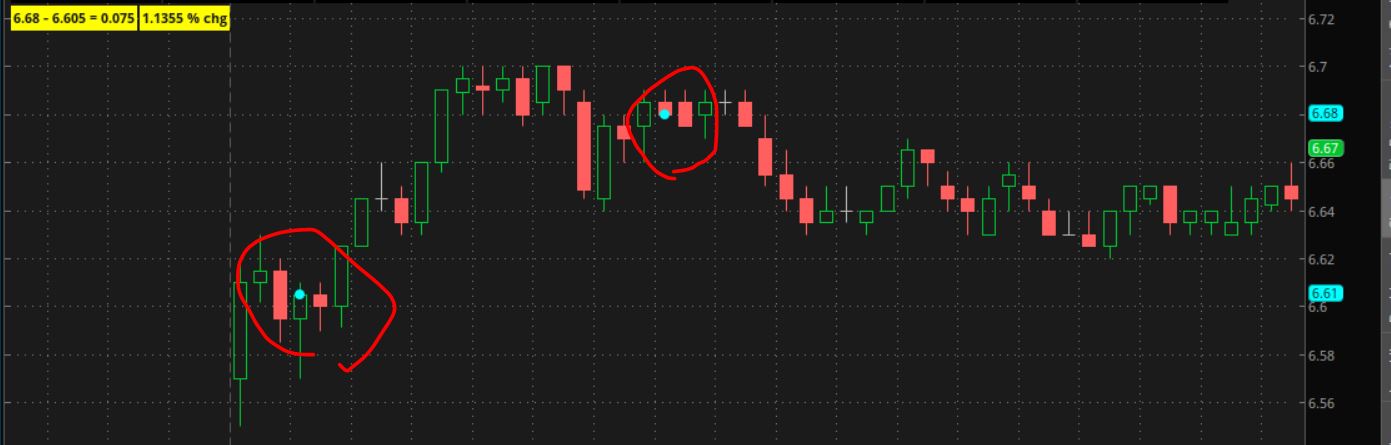
input start = 0945;
input end = 1115;
def t1 = if secondsfromTime(start) >= 0 and secondstillTime(start) >= 0 then 1 else 0;
def t2 = if secondsfromTime(end) >= 0 and secondstillTime(end) >= 0 then 1 else 0;
def cls1 = if diffday then 1 else if t1 then close else cls1[1];
def cls2 = if diffday then 1 else if t2 then close else cls2[1];
def diff = if t2 then cls2 - cls1 else diff[1];
def per = 100 * diff / cls1;
addlabel(1, (cls2 + " - " + cls1 + " = " + diff), color.yellow);
addlabel(1, per + " % chg", color.yellow);
plot zcls1 = if t1 then close else double.nan;
zcls1.SetPaintingStrategy(PaintingStrategy.POINTS);
zcls1.SetDefaultColor(Color.cyan);
zcls1.setlineweight(5);
#zcls1.hidebubble();
plot zcls2 = if t2 then close else double.nan;
zcls2.SetPaintingStrategy(PaintingStrategy.POINTS);
zcls2.SetDefaultColor(Color.cyan);
zcls2.setlineweight(5);
#zcls2.hidebubble();
#