
Hello, I've been frustrated a how different the TOS Hull moving average is compared to hand-coded versions (this has been noted by others on previous threads).
To try to nail down the discrepancies I want to create and chart synthetic data and apply the TOS Hull to it. (Code below)
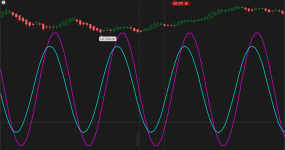
Once I have the synthetic data in the chart and am applying the Hull to it:
I can't find in Chart Settings how to hide the original price data. Any help is greatly appreciated, thanks!
To try to nail down the discrepancies I want to create and chart synthetic data and apply the TOS Hull to it. (Code below)
Once I have the synthetic data in the chart and am applying the Hull to it:
I can't find in Chart Settings how to hide the original price data. Any help is greatly appreciated, thanks!
Code:
# Inputs
input period = 20;      # Number of bars for one full sine wave cycle
input amplitude = 200;  # Adjust amplitude for the sine wave
input hullPeriod = 13;  # Period for the Hull Moving Average

# Calculate bar-based frequency
def barIndex = BarNumber();                   # Get the bar number
def normalizedIndex = barIndex - Floor(barIndex / period) * period;  # Modulus operation
def angle = normalizedIndex * 360 / period;   # Calculate angle in degrees

# Generate sine wave
def SyntheticData = amplitude * Sin(angle * Double.Pi / 180);  # Convert angle to radians

# Apply Hull Moving Average
def wma1 = WMA(SyntheticData, hullPeriod / 2);                 # WMA with half the Hull period
def wma2 = WMA(SyntheticData, hullPeriod);                     # WMA with the full Hull period
def hullMA = WMA(2 * wma1 - wma2, Sqrt(hullPeriod));           # Hull Moving Average formula

# Plot synthetic data and Hull MA
plot OriginalSyntheticData = SyntheticData;
OriginalSyntheticData.SetDefaultColor(Color.CYAN);
OriginalSyntheticData.SetLineWeight(2);

plot HullMovingAverage = hullMA;
HullMovingAverage.SetDefaultColor(Color.MAGENTA);
HullMovingAverage.SetLineWeight(2);
Attachments
Last edited:
