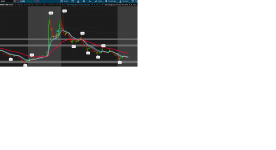
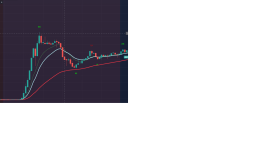
This indicator is the Market structure , and does a good job But the HH and Hl ,LL . LH is shown with white and can be too for the eyes the labels ---- can anyone change the white label with something much simple for the eye ,,, I attached a picture fro tradeview where the label are more light for the eye ,,,
#PAS_sample by JayC @ https://futures.io/thinkorswim/56934-price-action-swing-conversion.html
input lookBack = 10;
input lookAhead = 5;
def isHigh = high >= Highest(high[1], lookBack) and high >= Highest(high[-lookAhead], lookBack);
def highValue = if BarNumber() < lookBack then Double.NaN else if isHigh then high else highValue[1];
AddChartBubble(isHigh and highValue != highValue[1], high, if highValue > highValue[1] then "HH" else "LH", Color.white, yes);
#Added By DW
def LH = highValue < highValue[1];
plot LowerHigh = LH;
def isLow = low <= Lowest(low[1], lookBack) and low <= Lowest(low[-lookAhead], lookBack);
def lowValue = if BarNumber() < lookBack then Double.NaN else if isLow then low else lowValue[1];
AddChartBubble(isLow and lowValue != lowValue[1], low, if lowValue > lowValue[1] then "HL" else "LL", Color.white, no);
#Added By DW
def HL = lowValue > lowValue[1];
plot HigherLow = HL;
#end code
#ZigZag Percent
# TD Ameritrade IP Company, Inc. (c) 2011-2021
#
input price = close;
input reversalAmount = 8.0;
input showBubbles = no;
input showLabel = no;
assert(reversalAmount > 0, "'reversal amount' should be positive: " + reversalAmount);
plot "ZZ%" = reference ZigZagHighLow(price, price, reversalAmount, 0, 1, 0);
def zzSave = if !IsNaN("ZZ%") then price else getValue(zzSave, 1);
def chg = (price / getValue(zzSave, 1) - 1) * 100;
def isUp = chg >= 0;
def isConf = AbsValue(chg) >= reversalAmount or (IsNaN(getValue("ZZ%", 1)) and getValue(isConf, 1));
"ZZ%".EnableApproximation();
"ZZ%".DefineColor("Up Trend", Color.UPTICK);
"ZZ%".DefineColor("Down Trend", Color.DOWNTICK);
"ZZ%".DefineColor("Undefined", Color.DARK_ORANGE);
"ZZ%".AssignValueColor(if !isConf then "ZZ%".color("Undefined") else if isUp then "ZZ%".color("Up Trend") else "ZZ%".color("Down Trend"));
DefineGlobalColor("Unconfirmed", Color.DARK_ORANGE);
DefineGlobalColor("Up", Color.UPTICK);
DefineGlobalColor("Down", Color.DOWNTICK);
def barNumber = barNumber();
AddChartBubble(showBubbles and !IsNaN("ZZ%") and barNumber != 1, price, round(chg) + "%", if !isConf then globalColor("Unconfirmed") else if isUp then globalColor("Up") else globalColor("Down"), isUp);
AddLabel(showLabel and barNumber != 1, (if isConf then "Confirmed " else "Unconfirmed ") + "ZigZag: " + round(chg) + "%", if !isConf then globalColor("Unconfirmed") else if isUp then globalColor("Up") else globalColor("Down"));
input alerts = yes;
alert(alerts and isHigh[4] and highValue[4] != highValue[4+1], "High", alert.bar, sound.chimes);
alert(alerts and isLow[4] and lowValue[4] != lowValue[4+1], "Low", alert.bar, Sound.Ding);