johnwood34
Member
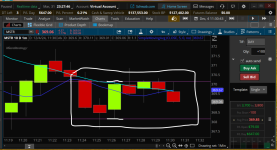
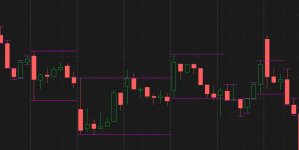
So...I'm currently backtesting candle range theory. Let's say my current candle range is a bullish candle. I mark the high and low of it. If that range is broken buy another bullish candle, I have to move my lines up to frame the high and low it. (My new range) If it had been broken by a bearish candle, I'd then have moved my lines down to frame that candle. Well...I'm monitoring five time frames, so constantly having to move my lines on each chart can be a tedious task. It's not as often on the high timeframes but on the lower ones, while price action is moving much quicker, this can be daunting. Is there an indicator available that would automatically map those lines out for me? Not a previous candle high and low. One that only maps out those tops and bottoms of the candle that closes out side of that range, creating a new one? Ive included a pic for reference. Candle underlined is the current range. Thanks in advance...