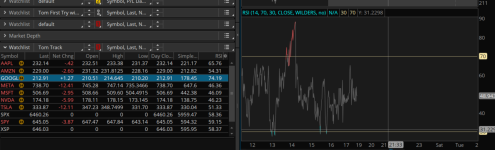
This has given me lots of problems...as you can see in the image my watch list is getting a different RSI for the symbol in question and its drastically different.
My watch list shows a live 74.19 while the chart shows a live 48.94. I have tried everything i can imagine.. From changing the type to simple and etc.. both are using a close and 14 for the data.. As i have opened the rsi in the chart and it clearly show 14 and close and looking at the rsi on my watchlist shows exactly the same..
In anyone has any suggestions as to what i might check i will forever be in your debt..
Of the many things i have tried, I went to Trading view and setup the RSI with close and 14 and the numbers on TV matched the exact same thing on my watchlist.. However the chart display on TOS is far away from TV or my TOS watchlist.
I am totally out of answers.. only questions.
I have made doubly sure that all entrys were done at close, 14 AND SIMPLE OF WILDER MODe and there seems to be little to no diff in using simple or wilder.
If i can provide any other images that might be helpful in analyzing this problem please let me know.