Bulls v Bears For ThinkOrSwim

DigitsM

New member
VIP
The code in this thread is for the lower chart indicator.
The author states:
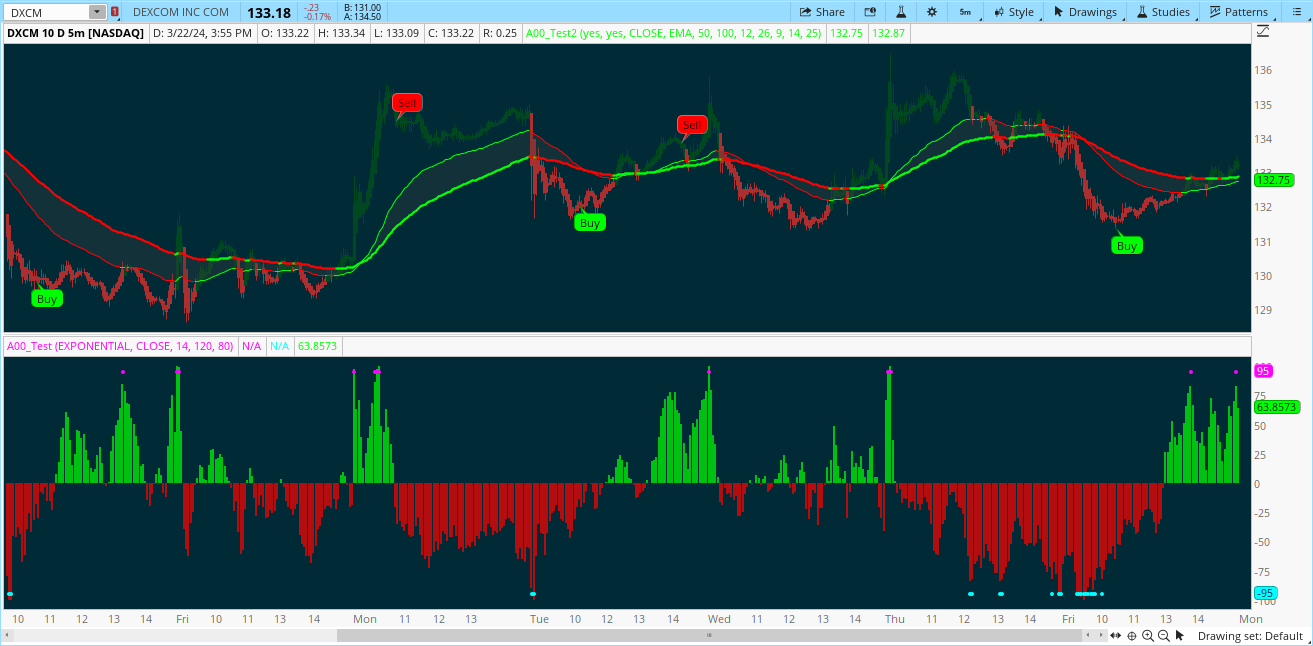
This script helps you identify the relative strength of bulls and bears in the market. It calculates the difference between the high and the moving average for bulls, and the difference between the moving average and the low for bears. Then it normalizes the values between -100 and 100 using the highest and lowest values of the last "bars back" periods. This allows you to compare the current strength of bulls and bears relative to their historical strength.

The output of the script is a colored column chart that represents the difference between the normalized bulls and bears values. If the chart is mostly green, it means the bulls are currently stronger than the bears, and vice versa for a mostly red chart. Additionally, the script provides bullish and bearish signals based on when the normalized bulls cross above or below the user-defined "Line Height" value.
You can use this script to help you identify potential trend changes in the market, as well as to confirm existing trends.

OP states:
The combination of this lower chart indicator with the upper chart study of Trend Trader https://usethinkscript.com/threads/trend-trader-buy-sell-signals-for-thinkorswim.18271/#post-139736 works really well.
RpTLCOI.png


https://www.tradingview.com/script/Ap9HknuH-Bulls-v-Bears/).
Appreciate if this is converted as well. Thanks in advance.
 
Last edited by a moderator:

Join useThinkScript to post your question to a community of 21,000+ developers and traders.

I used it in combination with the Bulls vs Bear Indicator (link https://www.tradingview.com/script/Ap9HknuH-Bulls-v-Bears/). This is a lower indicator, the combination of both works really well. Appreciate if this is converted as well. Thanks in advance.

View attachment 21413

//@version=4
study("Bulls v Bears")
// Input settings
len = input(title="BvB Period", type=input.integer, defval=14, minval=1)
bars_back = input(title="Nomralized bars back", type=input.integer, defval=120, minval=1)
tline = input(80, title="Line Height" )
// Calculation
ma = ema(close, len)
bulls = high - ma
bears = ma - low
// Normalize the values between -100 and 100
min_bulls = lowest(bulls, bars_back)
max_bulls = highest(bulls, bars_back)
norm_bulls = ((bulls - min_bulls) / (max_bulls - min_bulls) - 0.5) * 100
min_bears = lowest(bears, bars_back)
max_bears = highest(bears, bars_back)
norm_bears = ((bears - min_bears) / (max_bears - min_bears) - 0.5) * 100
// Calculate the total and add signals
total = norm_bulls - norm_bears
bullish_o = total > tline
bearish_o = total < -tline
// Plot the total with colored columns
col = total >= 0 ? color.green : color.red
plot(total, color=col, style=plot.style_columns, title="BvB")
plotshape(bullish_o, style=shape.circle, location=location.top, color=#ff00d4, title="Bullish Crossover")
plotshape(bearish_o, style=shape.circle, location=location.bottom, color=#eeff00, title="Bearish Crossover")
// Horizontal lines
hline(tline, color=color.gray)
hline(-tline, color=color.gray)
// Alerts
alertcondition(bullish_o, title="Bullish Crossover", message="Bullish overbought")
alertcondition(bearish_o, title="Bearish Crossover", message="Bearish oversold")
alertcondition(crossover(total, 0), title="Total Crossover", message="BvB total crossover")
check the below:

CSS:
# https://www.tradingview.com/v/Ap9HknuH/
#//@Mihkel00
#study("Bulls v Bears")
# Converted by Sam4Cok@Samer800    - 03/2024
declare lower;
#// Input settings
input movAvgType = AverageType.EXPONENTIAL;
input src = close;
input Period = 14;                  # "BvB Period"
input NomralizedBarsBack = 120;     # "Nomralized bars back"
input LineHeight = 80;              # "Line Height"


def na = Double.NaN;
#// Calculation
def ma = MovingAverage(movAvgType, src, Period);
def bulls = high - ma;
def bears = ma - low;

#// Normalize the values between -100 and 100
def min_bulls = Lowest(bulls, NomralizedBarsBack);
def max_bulls = Highest(bulls, NomralizedBarsBack);
def norm_bulls = ((bulls - min_bulls) / (max_bulls - min_bulls) - 0.5) * 100;

def min_bears = Lowest(bears, NomralizedBarsBack);
def max_bears = Highest(bears, NomralizedBarsBack);
def norm_bears = ((bears - min_bears) / (max_bears - min_bears) - 0.5) * 100;

#// Calculate the total and add signals
def total = norm_bulls - norm_bears;
def bullish_o = total > LineHeight;
def bearish_o = total < -LineHeight;

#// Plot the total with colored columns
def col = total >= 0;

plot BullCross = if bullish_o then 95 else na;     # "Bullish Crossover"
plot BearCross = if bearish_o then -95 else na;    # "Bearish Crossover"
BullCross.SetPaintingStrategy(PaintingStrategy.POINTS);
BearCross.SetPaintingStrategy(PaintingStrategy.POINTS);
BullCross.SetDefaultColor(Color.MAGENTA);
BearCross.SetDefaultColor(Color.CYAN);

plot BvB = total;
BvB.SetPaintingStrategy(PaintingStrategy.SQUARED_HISTOGRAM);
BvB.AssignValueColor(if col then color.GREEN else Color.RED);

#-- END of CODE
 

Similar threads

Not the exact question you're looking for?

Start a new thread and receive assistance from our community.

87k+ Posts
459 Online
Create Post

Similar threads

Similar threads

The Market Trading Game Changer

Join 2,500+ subscribers inside the useThinkScript VIP Membership Club
  • Exclusive indicators
  • Proven strategies & setups
  • Private Discord community
  • ‘Buy The Dip’ signal alerts
  • Exclusive members-only content
  • Add-ons and resources
  • 1 full year of unlimited support

Frequently Asked Questions

What is useThinkScript?

useThinkScript is the #1 community of stock market investors using indicators and other tools to power their trading strategies. Traders of all skill levels use our forums to learn about scripting and indicators, help each other, and discover new ways to gain an edge in the markets.

How do I get started?

We get it. Our forum can be intimidating, if not overwhelming. With thousands of topics, tens of thousands of posts, our community has created an incredibly deep knowledge base for stock traders. No one can ever exhaust every resource provided on our site.

If you are new, or just looking for guidance, here are some helpful links to get you started.

What are the benefits of VIP Membership?
VIP members get exclusive access to these proven and tested premium indicators: Buy the Dip, Advanced Market Moves 2.0, Take Profit, and Volatility Trading Range. In addition, VIP members get access to over 50 VIP-only custom indicators, add-ons, and strategies, private VIP-only forums, private Discord channel to discuss trades and strategies in real-time, customer support, trade alerts, and much more. Learn all about VIP membership here.
How can I access the premium indicators?
To access the premium indicators, which are plug and play ready, sign up for VIP membership here.
Back
Top