
woodyasher1969
New member
The author states:
Average Sentiment Oscillator
Momentum oscillator of averaged bull/bear percentages.
We suggest using it as a relatively accurate way to gauge the sentiment of a given period of candles, as a trend filter or for entry/exit signals.
It’s a combination of two algorithms, both essentially the same but applied in a different way. The first one analyzes the bullish/bearishness of each bar using OHLC prices then averages all percentages in the period group of bars (eg. 10) to give the final % value. The second one treats the period group of bars as one bar and then determines the sentiment percentage with the OHLC points of the group. The first one is noisy but more accurate in respect to intra-bar sentiment, whereas the second gives a smoother result and adds more weight to the range of price movement. They can be used separately as Mode 1 and Mode 2 in the indicator settings, or combined as Mode 0.
Original indicator idea from Benjamin Joshua Nash, converted from MT4 version
Usage:
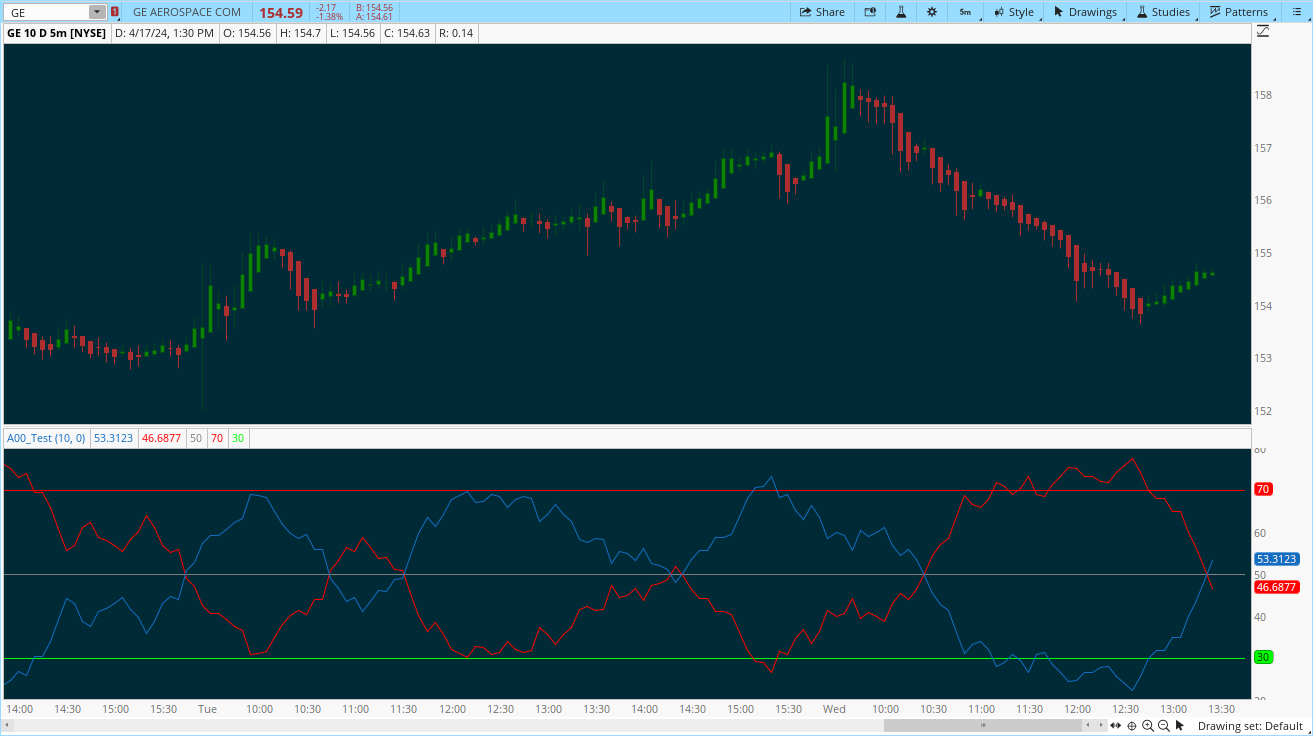
The blue line is Bulls %, red line is Bears %. As they are both percentages of 100, they mirror each other. The higher line is the dominating sentiment. The lines crossing the 50% centreline mark the shift of power between bulls and bears, and this often provides a good entry or exit signal, i.e. if the blue line closes above 50% on the last bar, Buy or exit Sell, if the red line closes above 50% on the last bar, Sell or exit Buy. These entries are better when average volume is high.
It's also possible to see the relative strength of the swings/trend, i.e. a blue peak is higher than the preceding red one. A clear divergence can be seen in the picture as the second bullish peak registers as a lower strength on the oscillator but moved higher on the price chart. By setting up levels at the 70% and 30% mark the oscillator can also be used for trading overbought/oversold levels similar to a Stochastic or RSI. As is the rule with most indicators, a smaller period gives more leading signals and a larger period gives less false signals.
Ruby:
# Average Sentiment Oscillator
# Converted from Pine Script https://www.tradingview.com/script/hz1PKu3G/
#by [Woodson Asher ]

declare lower;

input length = 10;
input mode = 0;

def intrarange = high - low;
def grouplow = Lowest(low, length);
def grouphigh = Highest(high, length);
def groupopen = open[length - 1];
def grouprange = grouphigh - grouplow;

def K1 = if intrarange == 0 then 1 else intrarange;
def K2 = if grouprange == 0 then 1 else grouprange;

def intrabarbulls = (((close - low) + (high - open)) / 2 * 100) / K1;
def groupbulls = (((close - grouplow) + (grouphigh - groupopen)) / 2 * 100) / K2;
def intrabarbears = (((high - close) + (open - low)) / 2 * 100) / K1;
def groupbears = (((grouphigh - close) + (groupopen - grouplow)) / 2 * 100) / K2;

def TempBufferBulls = if mode == 0 then (intrabarbulls + groupbulls) / 2 else if mode == 1 then intrabarbulls else groupbulls;
def TempBufferBears = if mode == 0 then (intrabarbears + groupbears) / 2 else if mode == 1 then intrabarbears else groupbears;

def ASOBulls = SimpleMovingAvg(TempBufferBulls, length);
def ASOBears = SimpleMovingAvg(TempBufferBears, length);

plot Bull = ASOBulls;
plot Bear = ASOBears;

def centerline = 50;
def overboughtLevel = 70;
def oversoldLevel = 30;

plot CL = centerline;
CL.SetDefaultColor(Color.GRAY);

plot Overbought = overboughtLevel;
Overbought.SetDefaultColor(Color.RED);

plot Oversold = oversoldLevel;
Oversold.SetDefaultColor(Color.GREEN);

Bull.SetDefaultColor(Color.BLUE);
Bear.SetDefaultColor(Color.RED);
Last edited by a moderator: