Good morning, I am having trouble with my friend's TV script for ToS.
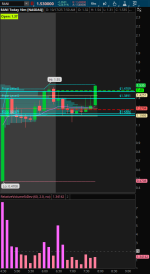
I'd like to auto plot horizontal lines that tracks the closing price of candles when certain criteria is met regarding the RelativeVolumeStDev for multiple timeframes including PM/AH. For example, I included a screen shot of what it should look like if I'd manually draw the lines of the close. Thanks in advance!
Criteria:
- If RelativeVolumeStDev is 2.0, plot line as weak "W" chart bubble (cyan line)
- If RelativeVolumeStDev is 3.0, plot line as strong "S" chart bubble (light gray line)
- If RelativeVolumeStDev is 4.0, plot line as extra strong "XS" chart bubble (purple line)
- If RelativeVolumeStDev is 5.0, plot line as super strong "SS" chart bubble (orange line)