Hello,
I've always been a lurker and never contributed and I figured some folks would really like this. I like to sell PUTS and CALLS. It just became too tedious to always determine what ROI my strike/options premium I was selling by punching it out on a calculator. So, I figured out a nice tidy custom script to add to your list on the options grid that immediately tells you in real time what your annualized ROI is going to be!
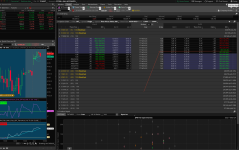
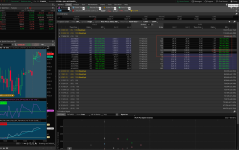
I shoot for 30% annualized on all of my trades. Therefore, the numbers turn red if below 30% (you can change it if you like). So for this example if you're thinking of selling the 17 Nov JPM Puts to get a 30% ROI you need to select the 134 strike with a .4 Delta. If that's too close for you then you need to move on! It's a beautiful way of seeing how much juice is in the options!!
Speaking of JUICE, look at the second example of PLTR! The ROI is INSANE at a .4sh Delta. Of course, its a week from ER, but you get the point!
I hope you guys like this. It was a sigh of relief to figure this out. Have fun!
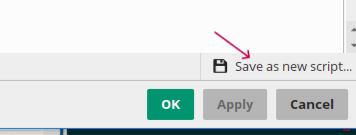
For those of you less TOS savvy, select "layout" on the options grid and "customize". Then drag over a custom data line. Use the example below. You have to touch the little scroll "thingie" to copy and paste this code into:
Code:
# Custom Annualized ROI Script for thinkorswim
# Define the necessary variables
def optionPrice = bid; # Using the bid price as the option price
def daysToExpiration = GetDaysToExpiration() - 1; # Subtracting 3 days
def strikePrice = GetStrike();

# Calculate ROI
def ROI = (optionPrice * 365) / (daysToExpiration * strikePrice);

# Display ROI in the custom quote column
AddLabel(yes, "ROI: " + AsPercent(ROI), (if ROI >= 0.30 then Color.GREEN else Color.RED));
Attachments
Last edited by a moderator:


