Alpha Time Periods for ThinkorSwim

korygill

Well-known member
VIP
If you follow volume profile or TPO or the combo of the two MonkeyBars on thinkorswim, you probably notice thinkorswim does not show the time periods with alpha characters.

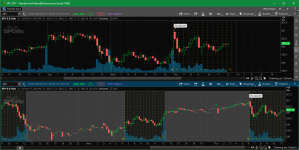
This study shows time periods A through M as pictured below.

v2dRNyc.png


Link to Flex Grid with the study (you get source code with that too)

https://tos.mx/Iq1q2RX

Source

Code:
#
#AlphaTimePeriods
#
# Author: Kory Gill, @korygill
#
#

declare upper;
declare hide_on_daily;
declare once_per_bar;

#
# You can turn off everything if you want or when you're done using it.
#
input showAlphaTimePeriods = yes; #hint showAlphaTimePeriods: if no, hides the AlphaTimePeriods study
input showTodayOnly = yes;
input timeOffsetFromEST = -300; #hint timeOffsetFromEST: 24-hour time offset from EST (-300 for PST)

DefineGlobalColor("A", CreateColor(255, 255, 0));
DefineGlobalColor("BtoEOD", CreateColor(128, 128, 0));

def aggPeriod = GetAggregationPeriod();
def isToday = GetDay() == GetLastDay();
def showPlot = if (aggPeriod <= AggregationPeriod.THIRTY_MIN) and
                  (showTodayOnly == no or isToday)
               then 1
               else 0;

def startTime = 0630 - timeOffsetFromEST;;

AddVerticalLine(
    showPlot and SecondsFromTime(startTime) == 60 * 0,
    "A",
    GlobalColor("A"));

AddVerticalLine(
    showPlot and SecondsFromTime(startTime) == 60 * 30,
    "B",
    GlobalColor("BtoEOD"));

AddVerticalLine(
    showPlot and SecondsFromTime(startTime) == 60 * 60,
    "C",
    GlobalColor("BtoEOD"));

AddVerticalLine(
    showPlot and SecondsFromTime(startTime) == 60 * 90,
    "D",
    GlobalColor("BtoEOD"));

AddVerticalLine(
    showPlot and SecondsFromTime(startTime) == 60 * 120,
    "E",
    GlobalColor("BtoEOD"));

AddVerticalLine(
    showPlot and SecondsFromTime(startTime) == 60 * 150,
    "F",
    GlobalColor("BtoEOD"));

AddVerticalLine(
    showPlot and SecondsFromTime(startTime) == 60 * 180,
    "G",
    GlobalColor("BtoEOD"));

AddVerticalLine(
    showPlot and SecondsFromTime(startTime) == 60 * 210,
    "H",
    GlobalColor("BtoEOD"));

AddVerticalLine(
    showPlot and SecondsFromTime(startTime) == 60 * 240,
    "I",
    GlobalColor("BtoEOD"));

AddVerticalLine(
    showPlot and SecondsFromTime(startTime) == 60 * 270,
    "J",
    GlobalColor("BtoEOD"));

AddVerticalLine(
    showPlot and SecondsFromTime(startTime) == 60 * 300,
    "K",
    GlobalColor("BtoEOD"));

AddVerticalLine(
    showPlot and SecondsFromTime(startTime) == 60 * 330,
    "L",
    GlobalColor("BtoEOD"));

AddVerticalLine(
    showPlot and SecondsFromTime(startTime) == 60 * 360,
    "M",
    GlobalColor("BtoEOD"));

AddVerticalLine(
    showPlot and SecondsFromTime(startTime) == 60 * 390,
    "EOD",
    GlobalColor("BtoEOD"));

#
# End of script
#
 

Attachments

  • v2dRNyc.png
    v2dRNyc.png
    138.9 KB · Views: 119
I have been spending some time with monkey bars and found this single post thread. Thought I would add a tweak to the monkey script and ask for a bit of help:

I wanted to reduce how much I have to handle the mouse to read price detail. So, I added the following labels to the Monkey Bar script to clearly see the POC and Value areas. Just paste at the end.

AddLabel(yes,"Monkey Bar:" + MBar, Color.Light_ORANGE);
AddLabel(yes,"PGHigh:" + hPG, Color.Light_ORANGE);
AddLabel(yes,"PGLow:" + lPG, Color.Light_ORANGE);

As for help, I would like to add an opacity input to the Volume component of Monkey bars so volume not prominent. I added an input "VolumeOpacity." But, I cannot make it functional.

Thanks. Hope the labels help someone.
 

Join useThinkScript to post your question to a community of 21,000+ developers and traders.

Similar threads

Not the exact question you're looking for?

Start a new thread and receive assistance from our community.

87k+ Posts
370 Online
Create Post

Similar threads

Similar threads

The Market Trading Game Changer

Join 2,500+ subscribers inside the useThinkScript VIP Membership Club
  • Exclusive indicators
  • Proven strategies & setups
  • Private Discord community
  • ‘Buy The Dip’ signal alerts
  • Exclusive members-only content
  • Add-ons and resources
  • 1 full year of unlimited support

Frequently Asked Questions

What is useThinkScript?

useThinkScript is the #1 community of stock market investors using indicators and other tools to power their trading strategies. Traders of all skill levels use our forums to learn about scripting and indicators, help each other, and discover new ways to gain an edge in the markets.

How do I get started?

We get it. Our forum can be intimidating, if not overwhelming. With thousands of topics, tens of thousands of posts, our community has created an incredibly deep knowledge base for stock traders. No one can ever exhaust every resource provided on our site.

If you are new, or just looking for guidance, here are some helpful links to get you started.

What are the benefits of VIP Membership?
VIP members get exclusive access to these proven and tested premium indicators: Buy the Dip, Advanced Market Moves 2.0, Take Profit, and Volatility Trading Range. In addition, VIP members get access to over 50 VIP-only custom indicators, add-ons, and strategies, private VIP-only forums, private Discord channel to discuss trades and strategies in real-time, customer support, trade alerts, and much more. Learn all about VIP membership here.
How can I access the premium indicators?
To access the premium indicators, which are plug and play ready, sign up for VIP membership here.
Back
Top