As Good As It Gets
SWING TRADING WITH HEIKIN ASHI
This is the Chart I now use for Overnight and Swing Trading.
SWING TRADING WITH HEIKIN ASHI
This is the Chart I now use for Overnight and Swing Trading.
Chart Link: http://tos.mx/!76Q21MQI MUST follow these instructions for loading shared links.

Confession: My trading for the past several years has usually been 0 DTE Day Trading. As I get older (81 next month) my lone brain cell doesn’t want to focus that rapidly anymore.
My new trading style is using Heinkin Ashi One Hour Chart with Entries/Exits taking place at 1-3 places.
First, trade the Heikin Ashi Candles on pivot from Red to Green, or Green to Red (proving very accurate on trades). Second, my Long/Short Bubbles are also proving accurate on this time frame. Third, the Murrey Math Pivots are good Entry/Exit points (especially when in agreement with one (or more) of other indicators.
My trades are now placed at least one week out as a single option, or a spread trade (I particularly like pivots showing in the last hour of trading especially pullbacks). I also like Spreads with the Long ATM (At The Money) and the Short OTM (Out of The Money). On these trades if direction is right, the Short Position Theta Decay is faster than the Long Theta Decay position making profitability easier to achieve. Also Risk is less with a spread.
When considering a trade look at the option chart for the trade you are wishing to make and see where most of the OI (Open Interest) activity is. Is it mostly on the Long/Short side. I usually like to trade inside where most of the OI activity is.
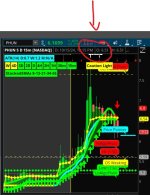
This chart setup includes the 14 Day ATR. the PSAR, Stacked EMA’s, the Long/Short Bubbles, the TI MTF’s, and the Traffic Light.
Also added is the Lower Squared Histogram which coordinates with the Long/Short Bubbles. The Profit Maximizer Arrows and Trend Line are in place as well as the Automatic VWAP. There is enough information on this chart to make successful trades.
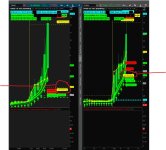
Notice on the included Chart for MSFT and AMD that there was overnight entries near close of yesterday which paid out nicely today.
One could basically use the Heikin Ashi candle color change for trades. Following the Heikin Ashi Color Candles on Day Charts is also good for longer term trades. We recommend, however, that multiple indicators are in agreement for placing trades.
Chart Visual:
Last edited by a moderator: