
The AGAIG Long Short Indicator has worked extremely well for me in regard to my "edge" in deciding when to make a trade. I combine it with Linear Regression channels to determine when to buy calls or puts.
Shared Grid Link: http://tos.mx/!HaJ8kylH Click here for --> Easiest way to load shared links

1. The System (Trader Brian Jones on X) - I use the 10/50 SMA and then add the 200 SMA to combine this strategy with the market
flow learned from Oscar Velez.
2. AGAIG No Arrows - This is the "Long/Short" indicator
3. AGAIG Reversal Pivot Lines - honestly could trade with only these two with good risk management
4. I use a combination of 3 different Linear Regression indicators. These indicators combined show me if
the trend on a stock is telling me I should be waiting on calls or puts.
a. Linear Regression Anchored Metal - Start 9:30 (Central), End 1600, endplottime 2359
b. Least Square Method - LSMAv2 - I turn off all of the plots on this except the
MiddleLR/UpperLR/LowerLR
c. Linear Regression Clouds - I use two of these. One plotted for the number of 30 minute candles
(extended hours off) over 10 day period (150) and another using 30 minute candles over 30 day
period (450). Both using deviation multiplier of 2.0 and filtering all signals.
5. My lower indicator is Sharkwave by TraderOracle. I adjusted the wt channel len to 27 and wt average
len to 36 as the indicator seemed to react better (slower) to my trading style.
My checklist is as follows...
1. Linear Regression/Sharkwave - indicate a likely support/resistance and reversal scenario? If the stock doesn't show overbought/sold in both it doesn't go into my daily "Eyes on" watchlist. Has the opening price/candle moved out of the upper/lower edges of the channels and looks to be moving back towards the center?
2. As Good As It Gets - Short/Long signal as well as Reversal Pivot Lines
3. The System SMA crossover - indicating buy/sell - keeping in mind the call/put contract decision is being based on the trend shown from linear regression
4. Oscar Valez - Is the SMA gap wide and in favor of shortening in the direction of the trend or is it very narrow in favor of expanding in the direction of the trend.
I believe I could trade just on 1 and 2 but adding the others gives me added confidence in either the trend of the stock or that the stock is consolidating or actually moving to the next area.
I usually only trade 3 contracts at a time and will close single contracts as they reach certain points. I don't wait for the "Long/Short" indicator to show up and then close all of them. If there doesn't appear to be any institutional moves happening, I'll take a small gain on 1 contract and continue using good risk management for the next 2 contracts.
It's not perfect but has really improved my understanding of market moves as well as my edge. If you are considering using the System, Oscar Velez, or Sharkwave (TraderOracle) indicators I'd highly suggest finding them and studying them before implementing them.
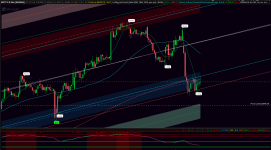
I also watch TNX:CGI (Interest on 10 year notes) and subscribe to Peter Tarr for Macro economic news which is something I'm now focusing on understanding more. Here's my chart. Hope this works as well for you guys as it has for me.
Shared Grid Link: http://tos.mx/!HaJ8kylH Click here for --> Easiest way to load shared links
1. The System (Trader Brian Jones on X) - I use the 10/50 SMA and then add the 200 SMA to combine this strategy with the market
flow learned from Oscar Velez.
2. AGAIG No Arrows - This is the "Long/Short" indicator
3. AGAIG Reversal Pivot Lines - honestly could trade with only these two with good risk management
4. I use a combination of 3 different Linear Regression indicators. These indicators combined show me if
the trend on a stock is telling me I should be waiting on calls or puts.
a. Linear Regression Anchored Metal - Start 9:30 (Central), End 1600, endplottime 2359
b. Least Square Method - LSMAv2 - I turn off all of the plots on this except the
MiddleLR/UpperLR/LowerLR
c. Linear Regression Clouds - I use two of these. One plotted for the number of 30 minute candles
(extended hours off) over 10 day period (150) and another using 30 minute candles over 30 day
period (450). Both using deviation multiplier of 2.0 and filtering all signals.
5. My lower indicator is Sharkwave by TraderOracle. I adjusted the wt channel len to 27 and wt average
len to 36 as the indicator seemed to react better (slower) to my trading style.
My checklist is as follows...
1. Linear Regression/Sharkwave - indicate a likely support/resistance and reversal scenario? If the stock doesn't show overbought/sold in both it doesn't go into my daily "Eyes on" watchlist. Has the opening price/candle moved out of the upper/lower edges of the channels and looks to be moving back towards the center?
2. As Good As It Gets - Short/Long signal as well as Reversal Pivot Lines
3. The System SMA crossover - indicating buy/sell - keeping in mind the call/put contract decision is being based on the trend shown from linear regression
4. Oscar Valez - Is the SMA gap wide and in favor of shortening in the direction of the trend or is it very narrow in favor of expanding in the direction of the trend.
I believe I could trade just on 1 and 2 but adding the others gives me added confidence in either the trend of the stock or that the stock is consolidating or actually moving to the next area.
I usually only trade 3 contracts at a time and will close single contracts as they reach certain points. I don't wait for the "Long/Short" indicator to show up and then close all of them. If there doesn't appear to be any institutional moves happening, I'll take a small gain on 1 contract and continue using good risk management for the next 2 contracts.
It's not perfect but has really improved my understanding of market moves as well as my edge. If you are considering using the System, Oscar Velez, or Sharkwave (TraderOracle) indicators I'd highly suggest finding them and studying them before implementing them.
I also watch TNX:CGI (Interest on 10 year notes) and subscribe to Peter Tarr for Macro economic news which is something I'm now focusing on understanding more. Here's my chart. Hope this works as well for you guys as it has for me.
Attachments
Last edited by a moderator:
