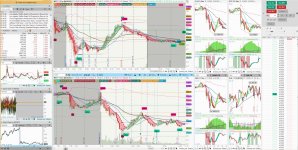
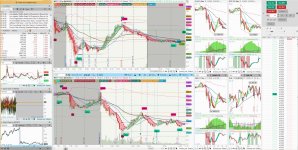
AGIG might be one of the best day trading strategies here so I customized it for a light color scheme and optimized it a bit - it uses less resources.
Even more optimization should be possible or one can simply remove some of the less useful studies.
I also renamed most of the studies so it is easier to find them and added some comments.
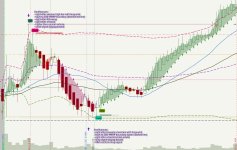
I added 2 more studies of my own: custom fractals and VWAP bands reversals signals as well as Pivot Channel Breakouts.
All appropriate credits go csricksdds https://usethinkscript.com/threads/agaig-best-trading-chart-setup-for-thinkorswim.18436/
I use some custom characters at one point, so you may need system font to display them correctly.
SetUp->Application Settings->General->Look and feel-> Use system font (check mark)
The most important factor in this complex study set is ability to use visual confluences or fractal energies - the more in alignment the better.

However, one should never take an asset and trade it in isolation from the general market context.
Thus it is usually desirable to see what the main indexes are doing and what is the S&P sector of our choice
like today (sympathy play) if we are interested in a stock (or stock option). The market breath indicators can be useful as well.
Multiple time frames make it easier to see the price direction (like 10M, 5M, 2M). A market catalyst will likely lead to a trend,
lack of news may increase probability of a range.
Price action is still the king regardless of how intelligent our technical analysis may become.
Tweak what you see until you like it!

WallyP
Workspace: AG-M1 https://tos.mx/!AKIeZ5bZ
5M Chart 5AMD https://tos.mx/!DaDmaK0w
2M Chart 2AMD https://tos.mx/!kJk6SWxg
Even more optimization should be possible or one can simply remove some of the less useful studies.
I also renamed most of the studies so it is easier to find them and added some comments.
I added 2 more studies of my own: custom fractals and VWAP bands reversals signals as well as Pivot Channel Breakouts.
All appropriate credits go csricksdds https://usethinkscript.com/threads/agaig-best-trading-chart-setup-for-thinkorswim.18436/
I use some custom characters at one point, so you may need system font to display them correctly.
SetUp->Application Settings->General->Look and feel-> Use system font (check mark)
The most important factor in this complex study set is ability to use visual confluences or fractal energies - the more in alignment the better.
However, one should never take an asset and trade it in isolation from the general market context.
Thus it is usually desirable to see what the main indexes are doing and what is the S&P sector of our choice
like today (sympathy play) if we are interested in a stock (or stock option). The market breath indicators can be useful as well.
Multiple time frames make it easier to see the price direction (like 10M, 5M, 2M). A market catalyst will likely lead to a trend,
lack of news may increase probability of a range.
Price action is still the king regardless of how intelligent our technical analysis may become.
Tweak what you see until you like it!
WallyP
Workspace: AG-M1 https://tos.mx/!AKIeZ5bZ
5M Chart 5AMD https://tos.mx/!DaDmaK0w
2M Chart 2AMD https://tos.mx/!kJk6SWxg
Attachments
Last edited:


