I need someone's help to assist create a script that will mark the High / Low of the 1st 5 minute candle and add the price of total value.
SPY High at $500.00 Low $498.25 Total 5 min candle 1.75
This is basically what I'm looking for.
Today 5-13-25 on first 5 min candle 8:30 am to 8:35 am
High $584.31
Low $583.35
Total move = .96 cents
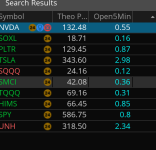
I would like to have a script that can automatically can do the math and give me the $.96 cent move on a custom column search
I have found this on line which marks the High and Low of the 1st 5 min candle, I just need help do it can do the calculation automatically. Thank you agian. I hope you can help me.
I also found this script that calculates the total atr move but I cant get it to work on the 5 min only
SPY High at $500.00 Low $498.25 Total 5 min candle 1.75
This is basically what I'm looking for.
Today 5-13-25 on first 5 min candle 8:30 am to 8:35 am
High $584.31
Low $583.35
Total move = .96 cents
I would like to have a script that can automatically can do the math and give me the $.96 cent move on a custom column search
I have found this on line which marks the High and Low of the 1st 5 min candle, I just need help do it can do the calculation automatically. Thank you agian. I hope you can help me.
I also found this script that calculates the total atr move but I cant get it to work on the 5 min only
Code:
*********************************************
input ATRLength = 14;
def ATR = Round(Average(TrueRange(high, close, low), ATRLength), 2);
AddLabel(yes, (ATR), Color.CYAN);
def agg10 = AggregationPeriod.FIVE_MIN;

input startTimeMarket = 0830;
input endTimeFirst5Minute = 0835;

def startCounter5 = SecondsFromTime(startTimeMarket);
def endCounter5 = SecondsTillTime(endTimeFirst5Minute);
def first5Minutes = if startCounter5 >= 0 and endCounter5 > 0 then 1 else 0;

******************************************************************************


#HL_TimeRange_using_ProfileHL

input begin = 0930;
input end = 0935;

input pricePerRowHeightMode = {AUTOMATIC, default TICKSIZE};
def height;
switch (pricePerRowHeightMode) {
case AUTOMATIC:
height = PricePerRow.AUTOMATIC;
case TICKSIZE:
height = PricePerRow.TICKSIZE;
}

def rth = if isnan(close) then rth[1] else SecondsFromTime(begin) >= 0 and SecondsTillTime(end) > 0;
def cond = rth != rth[1];

profile vol = VolumeProfile("startNewProfile" = cond and secondstilltime(end)>=0, "onExpansion" = no, "numberOfProfiles" = 1000, pricePerRow = height);


profile vol1 = VolumeProfile("startNewProfile" = cond, "onExpansion" = no, "numberOfProfiles" = 1000, pricePerRow = height);


def hProfile = if IsNaN(vol.GetHighest()) then hProfile[1] else vol1.GetHighest();
def lProfile = if IsNaN(vol.GetLowest()) then lProfile[1] else vol1.GetLowest();
def uprof = if !rth or IsNaN(close) then uprof[1] else hProfile;
def lprof = if !rth or IsNaN(close) then lprof[1] else lProfile;

plot ProfileHigh = uprof;
plot ProfileLow = lprof;

ProfileHigh.SetDefaultColor(Color.GREEN);
ProfileLow.SetDefaultColor(Color.RED);
ProfileHigh.SetPaintingStrategy(PaintingStrategy.HORIZONTAL);
ProfileLow.SetPaintingStrategy(PaintingStrategy.HORIZONTAL);
Attachments
Last edited by a moderator: