

|
| Here on useThinkScript, we dive deep into the latest discussions and highlight the most valuable indicators, set ups, and strategies which could give you the edge in this week's markets. Scroll down to check out this week's must reads, carefully selected by uTS Moderators! |
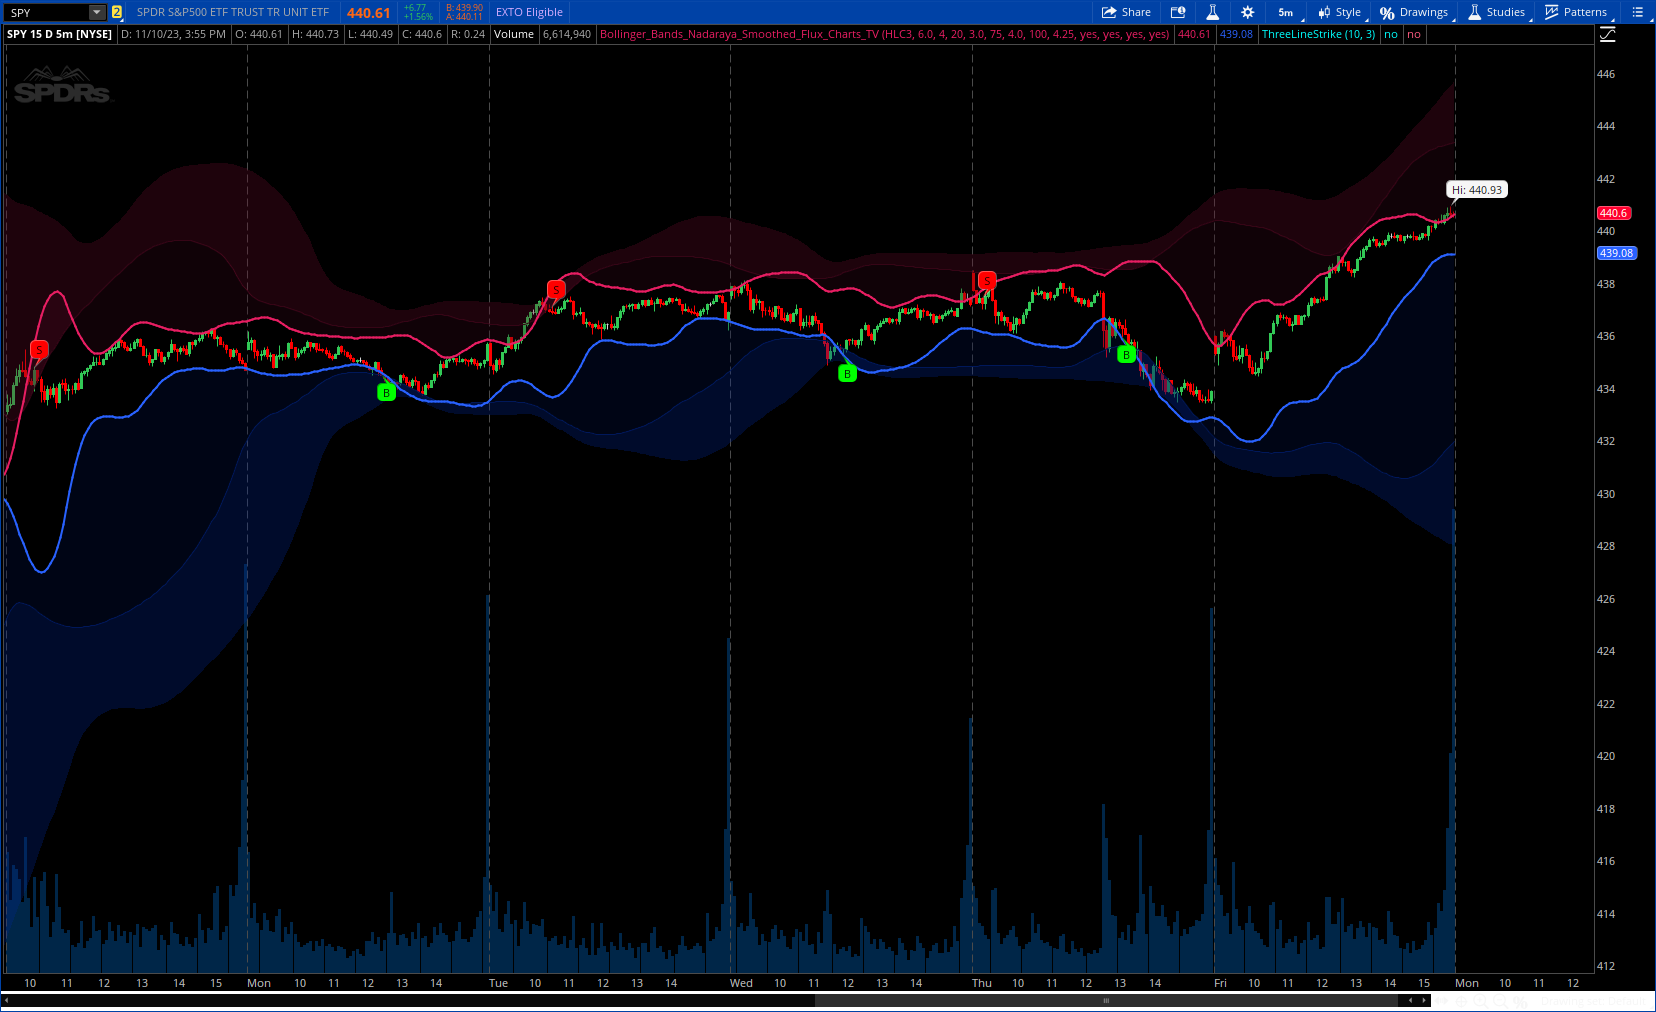
| samer800 said: This script is an upgrade to the classic Bollinger Bands. The idea behind Bollinger bands is the detection of price movements outside of a stock's typical fluctuations. Bollinger Bands use a moving average over period n plus/minus the standard deviation over period n times a multiplier. When price closes above or below either band this can be considered an abnormal movement. This script allows for the classic Bollinger Band interpretation while de-noising or "smoothing" the bands. |
|
| BenTen said: This indicator will scan for stocks with bearish and bullish MACD crossover on your watchlist and display it via a column. By default, it will look for crossover within the last 5 bars. You can change the lookback period to your liking in the code below. It works on all timeframe. Be sure to select the timeframe you want when adding the script. |

|
AVAILABLE TO VIP MEMBERS ONLY |
useThinkScript said: Market Drivers are events or factors that significantly impact stock prices and overall market movement. Recognizing and understanding these catalysts helps prepare day traders to spot opportunities, time their entries more effectively and manage risk. No matter how perfect the strategy, or how strong the signal; a trade, will lack the fuel to be profitable, unless there is something driving a trade:. At least, one of the following must be present for a trade to yield meaningful profits. Earnings Reports have the greatest single effect on individual stocks Some traders take the greatest risk and position themselves before earnings are announced.The majority of traders, research results, looking for the pullback or reversal after earnings. Earnings Scan: Click here to access... |

|
| Join our VIP Members Club to get access to our premium indicators including Buy The Dip, Advanced Market Moves and Take Profit. Your VIP membership includes: |
| ✓ Full access to public & private forums ✓ No Ads ✓ Priority community support ✓ Unlimited Postings ✓ Premium thinkorswim indicators ✓ Exclusive strategies, scanners, add-ons ✓ Discord chatroom with Trade Alerts |
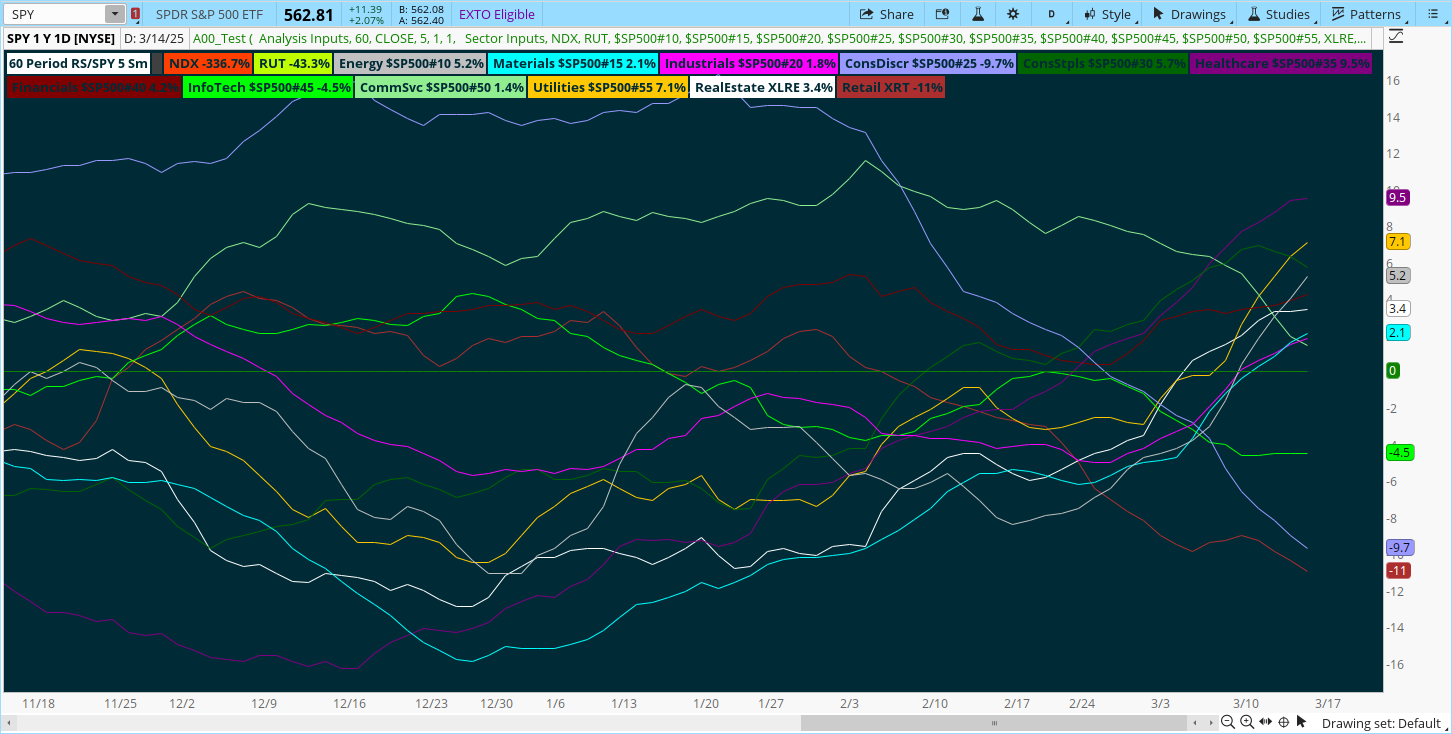
| RmS59 said: Here is a Sector Analysis Study that I created a few years ago and like. It ranks the sectors vs SP500 (or other). Also see the second version below. I developed the Relative Performance study first. The Relative Strength compares the sector performance vs the SPX. This also gives you a good idea of performance, but be wary when the SPX is down. A sector's performance may be better than the SPX, but still not be positive. So, I look at the Relative Strength first to see how the sectors compare to SPX, then check the RoC to see if change is actually positive. Since I mostly trade daily charts, I look at these indicators on a daily chart looking back 13 periods. When I trade weekly charts, I look at the same indicators on a weekly chart. |
|
FROM THE ARCHIVES: MAR 2022 |
| mikewest said: This strategy counts a number of lower highs then after the last candle that price crosses back above lowest high triggers the buy signal and sell signal if the price crosses below the 9 ema or closes below the close of the last candle This is to keep a clean chart for intraday trading on one minute chart so I can have multiple charts open on 1 screen and just see the labels if they red or green and select the one thats green to open on main screen. |

|
Last edited by a moderator: