

|
| Here on useThinkScript, we dive deep into the latest discussions and highlight the most valuable indicators, set ups, and strategies which could give you the edge in this week's markets. Scroll down to check out this week's must reads, carefully selected by uTS Moderators! |
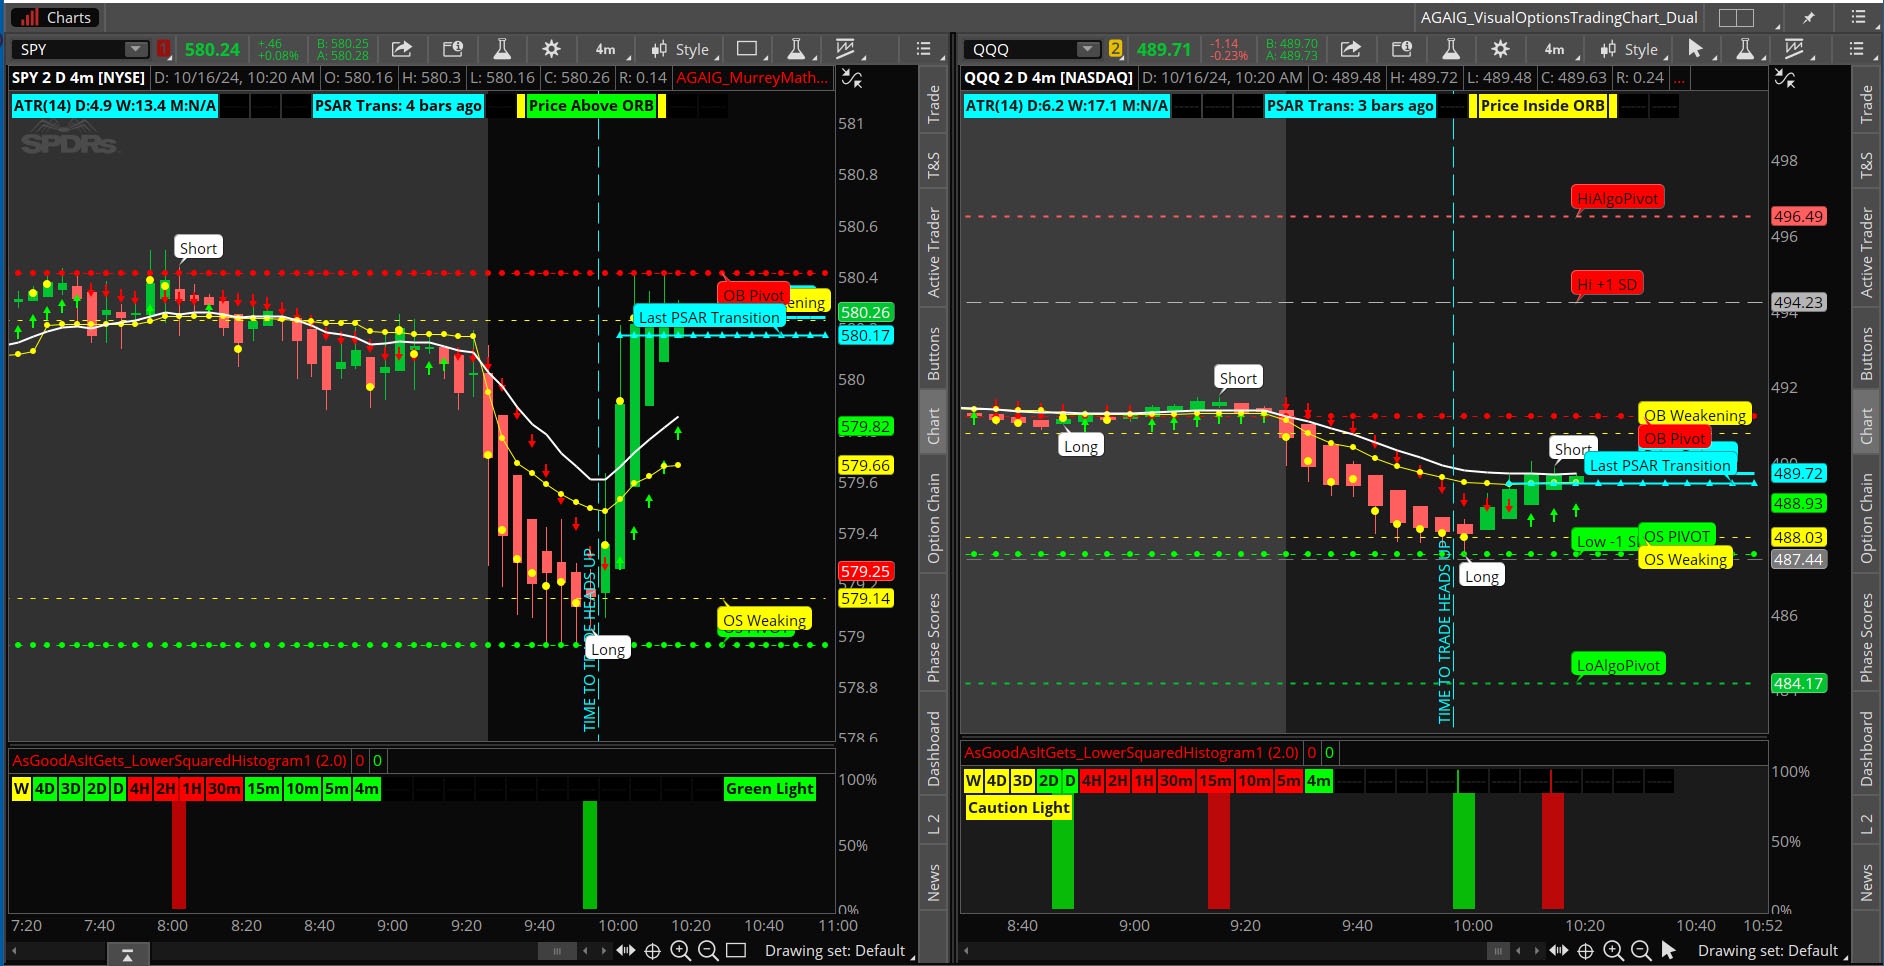
| csricksdds said: So, what is the best way to Day Trade? How do I Day Trade? What stocks (ETFs) are picked, and why do I pick them? How do I know when to enter and/or exit? The old song “knowing when to hold them, knowing when to fold them, knowing when to walk away and knowing when to run” fits well for an options' day trader! First of all let’s look at what to trade. I quit trading (for the most part) 0DTE (zero days until expiration) although I have done well with these during my foregone more alert days. Sometimes I will trade the ODE SPY, but not as much as I used to. Too many others work better with less stress and give more flexibility? I want stocks that: move more than five points (ATR) per day (based on a 9 period look back). Entries/Exits will be taken when the “intraday” has moved 1.75 - 2.0 of its daily intraday ATR (Intraday Average True Range). I mostly trade five contracts at a time. This will frequently give me 2-3 trades on the same stock each day. |
|
| BrooklynMintCapital said: The Trend Counter indicator is designed to help traders identify trend conditions and potential reversals by counting the number of bars within a specified period that are above or below an average price level. By smoothing and averaging these counts, the indicator provides a clear visual representation of market trends and highlights key trend changes. |

|
AVAILABLE TO VIP MEMBERS ONLY |
| useThinkScript said: Market Drivers are events or factors that significantly impact stock prices and overall market movement. Recognizing and understanding these catalysts helps prepare day traders to spot opportunities, time their entries more effectively and manage risk. No matter how perfect the strategy, or how strong the signal; a trade, will lack the fuel to be profitable, unless there is something driving a trade:. At least, one of the following must be present for a trade to yield meaningful profits... |

|
| Join our VIP Members Club to get access to our premium indicators including Buy The Dip, Advanced Market Moves and Take Profit. Your VIP membership includes: |
| ✓ Full access to public & private forums ✓ No Ads ✓ Priority community support ✓ Unlimited Postings ✓ Premium thinkorswim indicators ✓ Exclusive strategies, scanners, add-ons ✓ Discord chatroom with Trade Alerts |
| samer800 said: The Hyperbolic Tangent is designed for technical analysis, particularly in markets with assets that have lower prices or price ratios. This indicator leverages the Hyperbolic Tangent Moving Average (HTMA), a custom moving average calculated using the hyperbolic tangent function, to smooth price data and reduce the impact of short-term volatility. Include 3 studies to select from (Supertrend, Volatility Stop and Median Kijun-Sen) |

|
FROM THE ARCHIVES: APR 2023 |
| samer800 said: The Polynomial Regression Slope Indicator is a versatile and powerful tool for traders seeking to identify trends and potential entry or exit points in the market. By fitting a polynomial function to a dataset, this indicator can provide insights into the direction and strength of a trend over a specified time period. The indicator allows users to select the degree of the polynomial (1 for linear, 2 for quadratic, and 3 for cubic) to match their trading style and the characteristics of the market they are trading in. While higher-degree polynomials can offer a better fit to the data, we recommend using a polynomial... |

|
Last edited: