2025 -- January 15th newsletter

useThinkScript

Administrative
Staff member
Staff
VIP
Lifetime
KLD4L9n.png

New Indicators for ThinkorSwim

Hindenberg Omen, AlphaTrend, $TICK for Scalping, and more...!

Here on useThinkScript, we dive deep into the latest discussions and highlight the most valuable indicators, set ups, and strategies which could give you the edge in this week's markets.
Scroll down to check out this week's must reads, carefully selected by uTS Moderators!

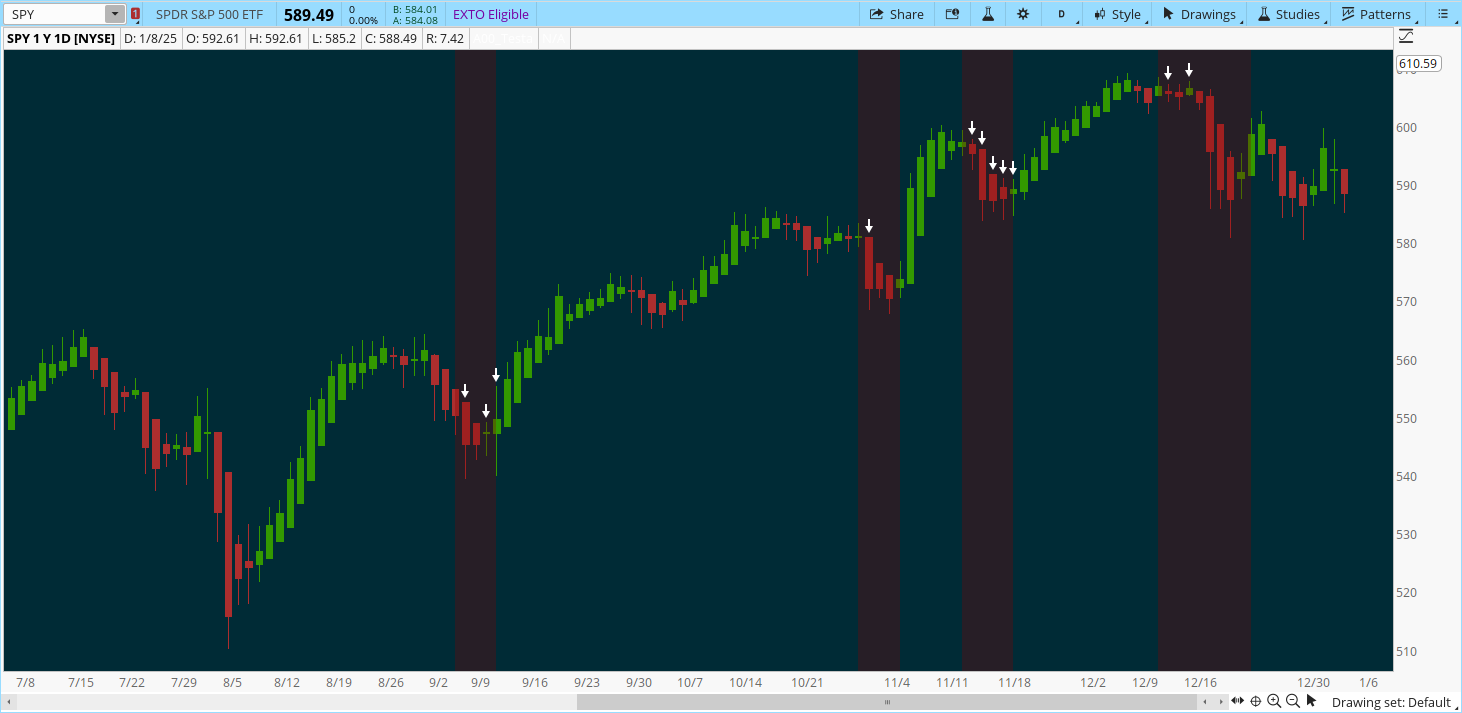
finnovator said:

"Hindenburg's Omen" is a technical indicator in financial analysis designed to predict a potential significant decline or a stock market crash.

How it works
  • Hindenburg's Omen is triggered when several conditions are met simultaneously on a stock market:
    • A high number of stocks reaching both new highs and lows over 52 weeks (usually more than 2.2% of stocks).
    • The number of new highs must not exceed twice the number of new lows.
    • The stock index must be in an upward trend (positive 50-day or 10-week moving average).
The McClellan Oscillator (sentiment indicator) should be negative.
wZa0ze0.png

samer800 said:


Here my conversion with option of AlphaTrend and AlphaTrend Max
With Trend Magic; we had some problems.
  1. To minimize stop losses and overcome sideways market conditions
  2. To have more accurate BUY/SELL signals during trending market conditions
  3. To have significant support and resistance levels
  4. To bring together indicators from different categories that are compatible with each other and make a meaningful combination regarding momentum, trend, volatility, volume and trailing stop loss
PgdKySG.png

AVAILABLE TO VIP MEMBERS ONLY
rewardiaz said:

Recently, I was introduced to $TICK, and after a deep dive into its functionality, I’ve uncovered its potential value in scalping. My research indicates that $TICK measures the difference between the number of stocks trading on an uptick and those trading on a downtick on the New York Stock Exchange (NYSE).

With this understanding, I decided to create an indicator to visualize this process. I’m not sure if others already have this or if it’s available within our community, but I believe it could be a helpful addition to our toolkit. Nevertheless, happy trading

Understanding $TICK Movements
This study categorizes $TICK values into three distinct ranges, reflecting varying degrees of market activity...
Aiapp37.png
Join our VIP Members Club to get access to our premium indicators including Buy The Dip, Advanced Market Moves and Take Profit.

Your VIP membership includes:
✓ Full access to public & private forums
✓ No Ads
✓ Priority community support
✓ Unlimited Postings
✓ Premium thinkorswim indicators
✓ Exclusive strategies, scanners, add-ons
✓ Discord chatroom with Trade Alerts

Sesqui said:

This indicator implements the Optimum Predictor Indicator from Dr Ehler's book, "Rocket Science for Traders" in thinkscript and is provided for educational purposes.

The indicator implements Dr Ehler's algorithm which adds phasors of the smoothed and detrended price data and applies the Homodyne Discriminator to the result, returning the price cycle period (eg time to complete a full cycle).

The price cycle period is then refined via more detrending and EMA smoothing per the algorithm in Dr Ehler's book. The predictor line is plotted on the lower chart.

The algorithm is supplemented by computing the slope of the predictor line using a 2nd order accurate finite difference expression. The predictor line is colored green when its slope > 0 and red when its slope < 0.
QxD5E72.png


FROM THE ARCHIVES: JUN 2023
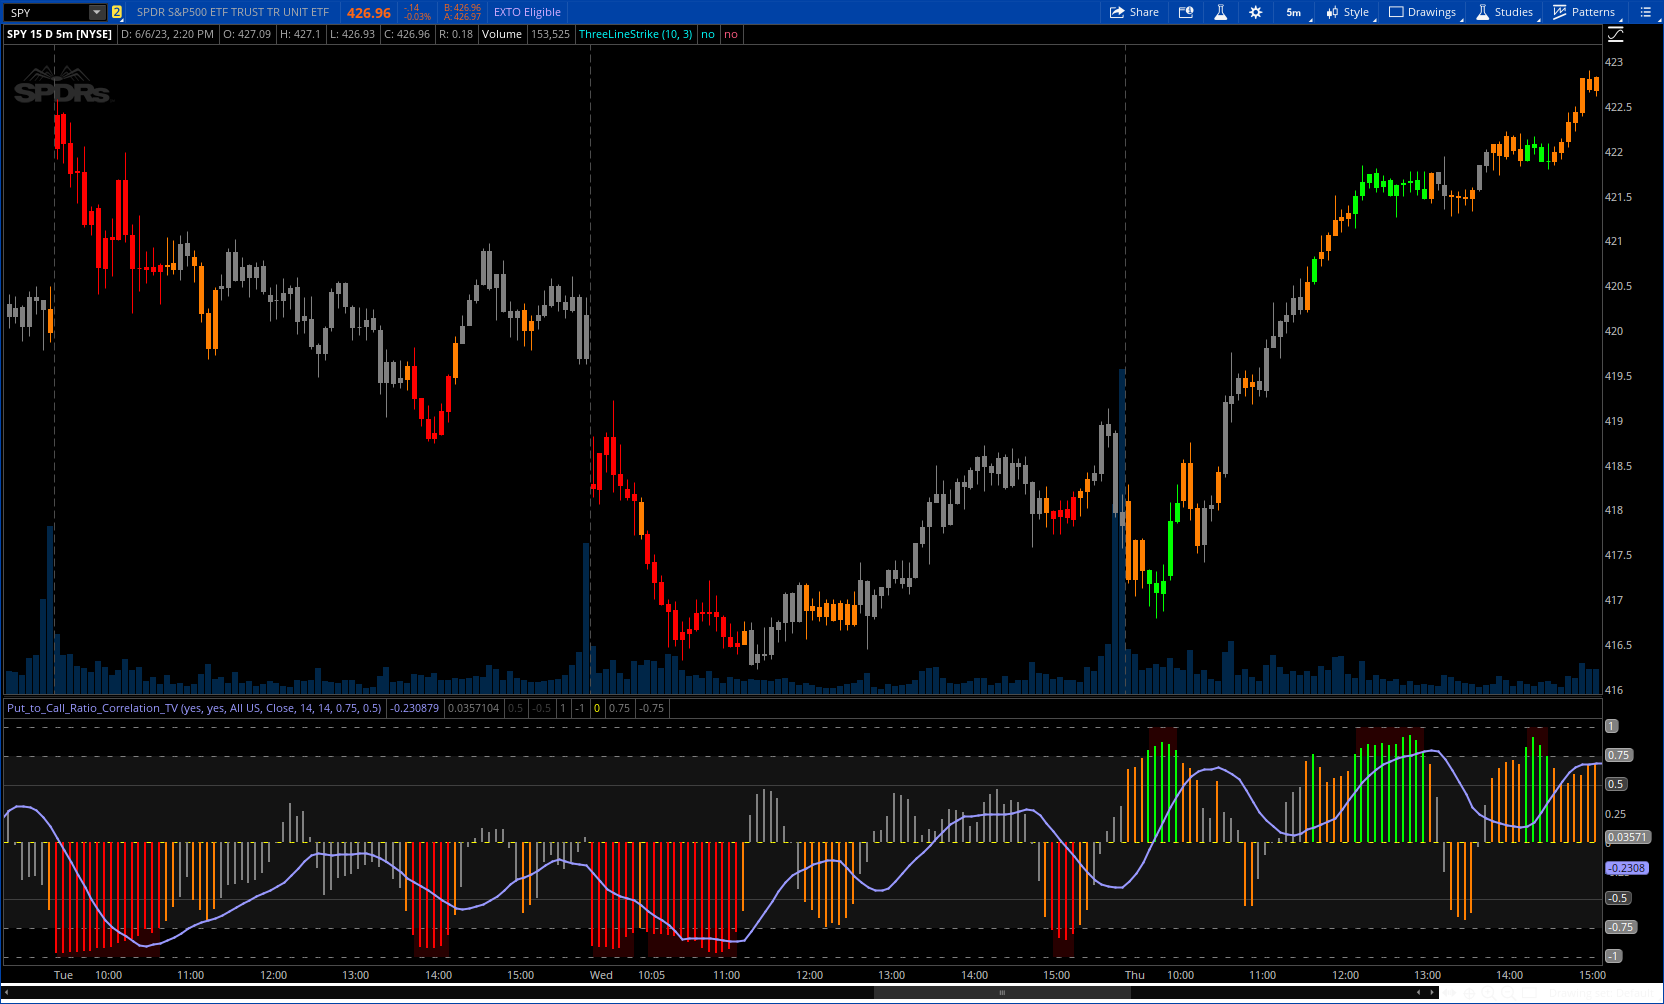
samer800 said:

This indicator is very simple. It pulls the data from the index and runs a correlation assessment against whichever ticker you are on.
Its helpful to correlate with indices such as SPY, IWM and QQQ, but I have had success correlating with individual tickers such as NVDA and AMD.
oDYBL66.png
 
Last edited by a moderator:

Join useThinkScript to post your question to a community of 21,000+ developers and traders.

Similar threads

Not the exact question you're looking for?

Start a new thread and receive assistance from our community.

87k+ Posts
385 Online
Create Post

Similar threads

Similar threads

The Market Trading Game Changer

Join 2,500+ subscribers inside the useThinkScript VIP Membership Club
  • Exclusive indicators
  • Proven strategies & setups
  • Private Discord community
  • ‘Buy The Dip’ signal alerts
  • Exclusive members-only content
  • Add-ons and resources
  • 1 full year of unlimited support

Frequently Asked Questions

What is useThinkScript?

useThinkScript is the #1 community of stock market investors using indicators and other tools to power their trading strategies. Traders of all skill levels use our forums to learn about scripting and indicators, help each other, and discover new ways to gain an edge in the markets.

How do I get started?

We get it. Our forum can be intimidating, if not overwhelming. With thousands of topics, tens of thousands of posts, our community has created an incredibly deep knowledge base for stock traders. No one can ever exhaust every resource provided on our site.

If you are new, or just looking for guidance, here are some helpful links to get you started.

What are the benefits of VIP Membership?
VIP members get exclusive access to these proven and tested premium indicators: Buy the Dip, Advanced Market Moves 2.0, Take Profit, and Volatility Trading Range. In addition, VIP members get access to over 50 VIP-only custom indicators, add-ons, and strategies, private VIP-only forums, private Discord channel to discuss trades and strategies in real-time, customer support, trade alerts, and much more. Learn all about VIP membership here.
How can I access the premium indicators?
To access the premium indicators, which are plug and play ready, sign up for VIP membership here.
Back
Top