

|
| Here on useThinkScript, we dive deep into the latest discussions and highlight the most valuable indicators, set ups, and strategies which could give you the edge in this week's markets. Scroll down to check out this week's must reads, carefully selected by uTS Moderators! |
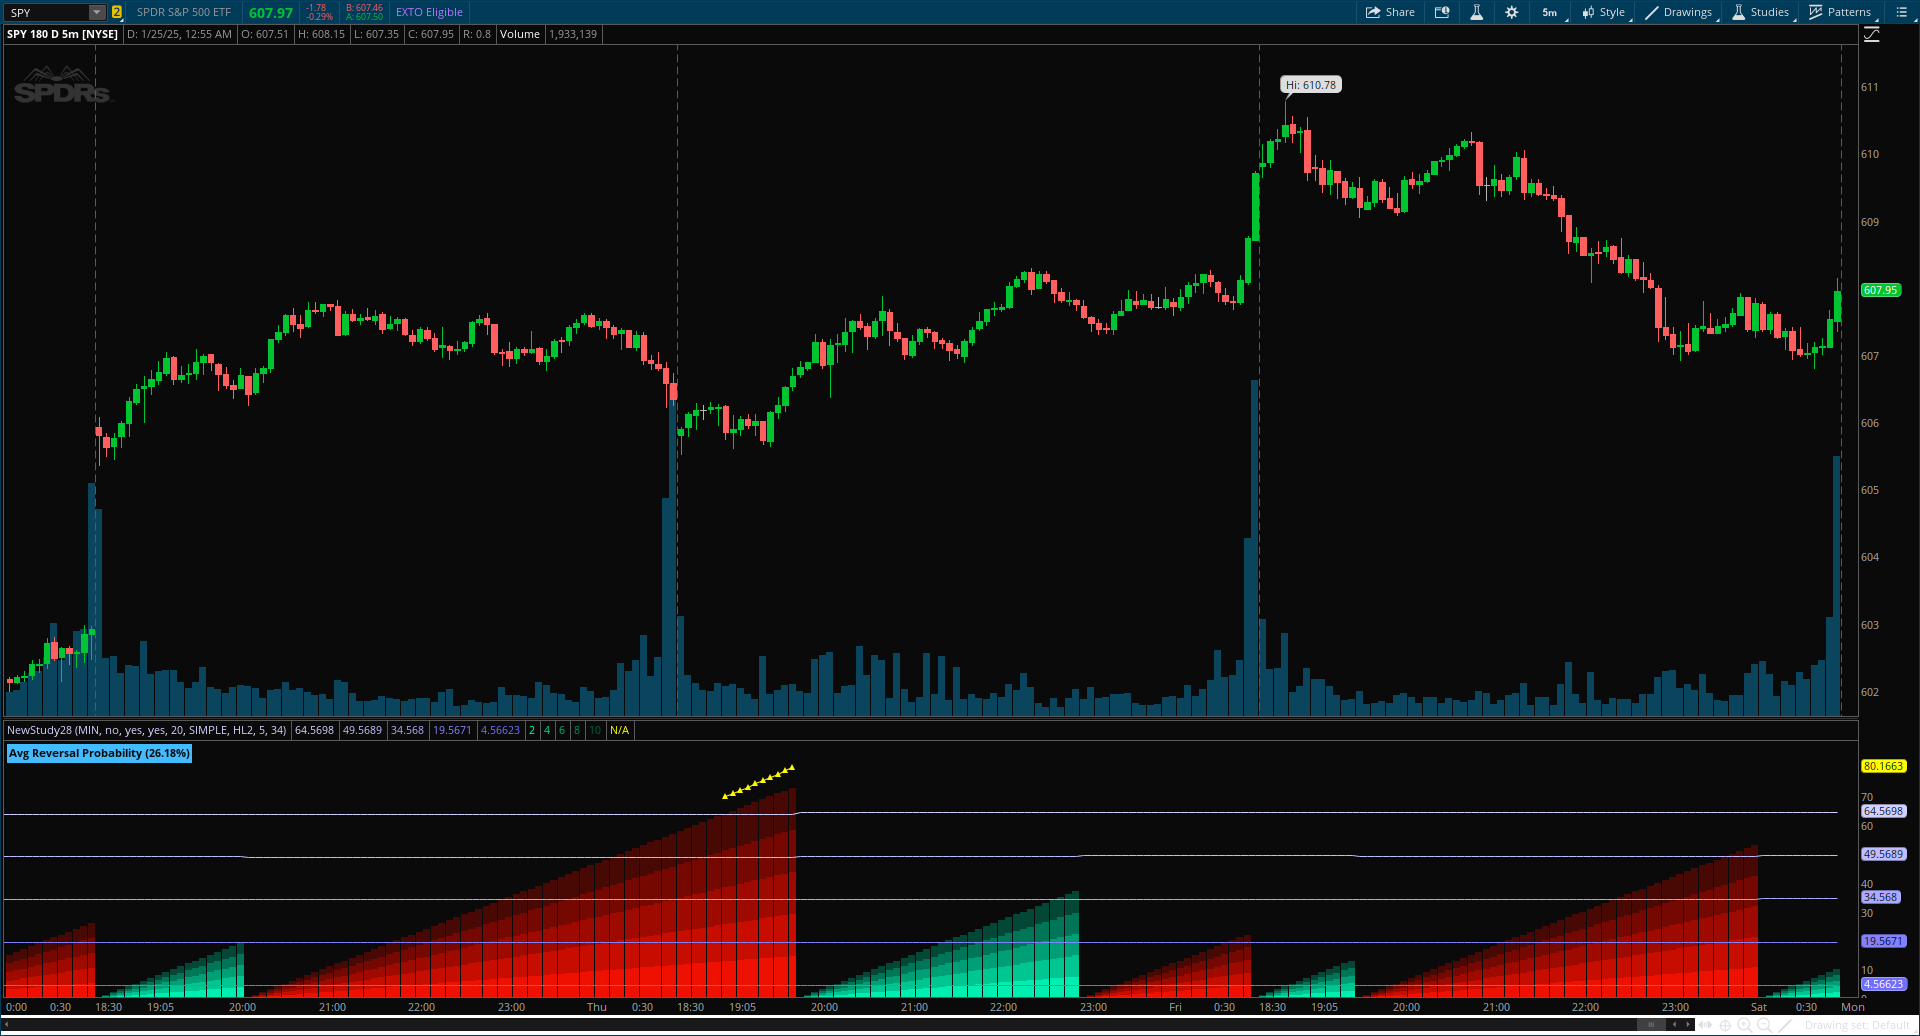
| samer800 said: Trend Reversal Probability by AlgoAlpha – a powerful indicator that estimates the likelihood of trend reversals based on an advanced custom oscillator and duration-based statistics. Designed for traders who want to stay ahead of potential market shifts, this indicator provides actionable insights into trend momentum and reversal probabilities. |
|
| samer800 said: The Prime Standard Deviation Bands [ChartPrime] indicator uses custom-calculated bands based on highest and lowest price values over specific period to analyze price volatility and trend direction. Traders can set the bands to 1, 2, or 3 standard deviations from a central base, providing a dynamic view of price behavior in relation to volatility. The indicator also includes color-coded trend signals, standard deviation labels, and mean reversion signals, offering insights into trend strength and potential reversal points. |

|
AVAILABLE TO VIP MEMBERS ONLY |
useThinkScript said: By watching how far or how fast prices move, traders can gain insight into whether a price move is likely to sustain itself or if the move has run its course This Volatility Indicator calculates the volatility of price increases (up candles) to the volatility of price decreases (down candles). To define the relative strength of buying versus selling. The higher number represents greater strength. Above the upper boundary .8 or below the lower boundary -.8 is considered definitive strength. The Volatility Indicator displays the up / down ratio as an oscillator. The oscillator is painted with volume and price direction / momentum |

|
| Join our VIP Members Club to get access to our premium indicators including Buy The Dip, Advanced Market Moves and Take Profit. Your VIP membership includes: |
| ✓ Full access to public & private forums ✓ No Ads ✓ Priority community support ✓ Unlimited Postings ✓ Premium thinkorswim indicators ✓ Exclusive strategies, scanners, add-ons ✓ Discord chatroom with Trade Alerts |
| samer800 said: The SMA Trend Spectrum indicator is designed to visually represent market trends and momentum by using a series of Simple Moving Averages (SMAs) to create a color-coded spectrum or heatmap. This tool helps traders identify the strength and direction of market trends across various time frames within one chart. |

|
FROM THE ARCHIVES: JUL 2022 |
| samer800 said: A faster version of MACD, based on ZeroLag EMA - see Technical Analysis of Stocks and Commodities, April 2000. |

|
Last edited by a moderator: