

|
| Here on useThinkScript, we dive deep into the latest discussions and highlight the most valuable indicators, set ups, and strategies which could give you the edge in this week's markets. Scroll down to check out this week's must reads, carefully selected by uTS Moderators! |
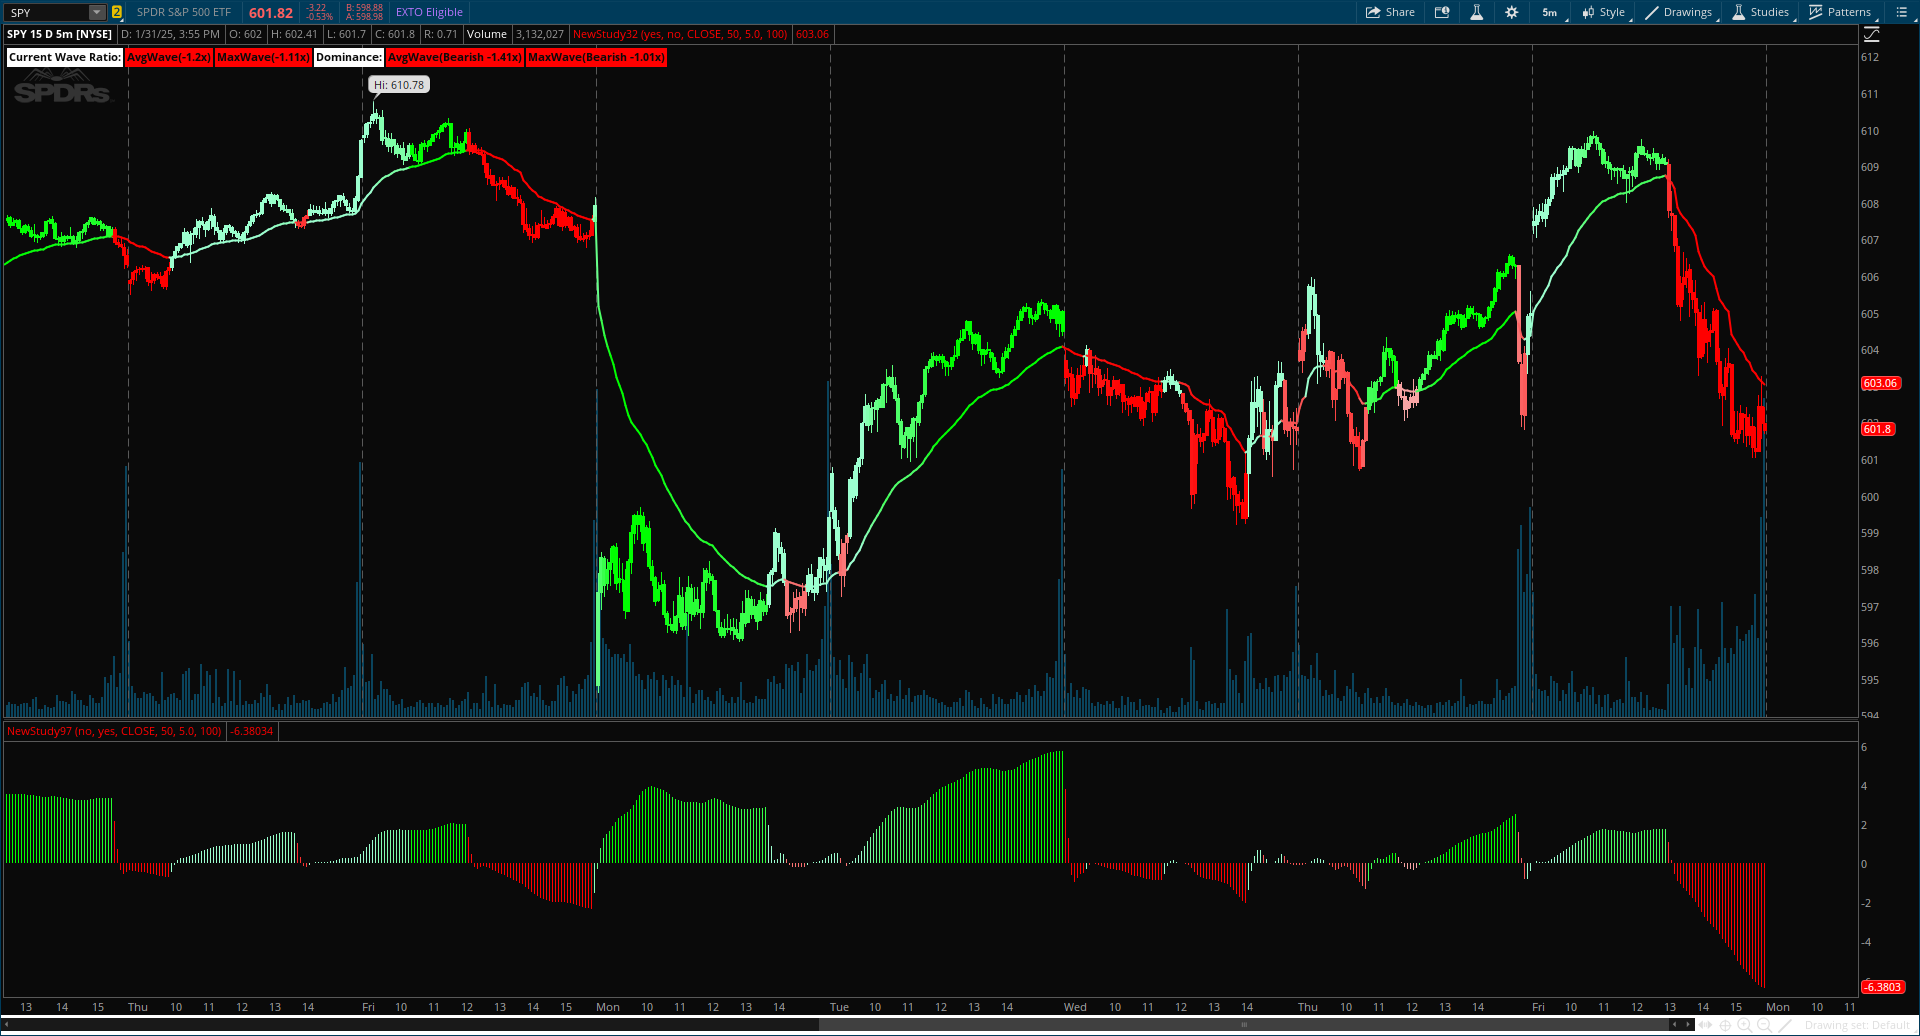
| The Trend Speed Analyzer by Zeiierman is designed to measure the strength and speed of market trends, providing traders with actionable insights into momentum dynamics. By combining a dynamic moving average with wave and speed analysis, it visually highlights shifts in trend direction, market strength, and potential reversals. This tool is ideal for identifying breakout opportunities, gauging trend consistency, and understanding the dominance of bullish or bearish forces over various timeframes. |
|
| rdlann026 said: The relative strength line tells you how strong a stock is relative to every other stock on the market. It is a time-tested technical analysis indicator that has been effective for decades–its longevity means it can be trusted and used with confidence and conviction. The relative strength line is often associated with the RS Rating 1-99, however this article focuses on the RS Line itself. |

|
AVAILABLE TO VIP MEMBERS ONLY |
useThinkScript said: If you’re not checking support and resistance before making entry, you’re basically flying blind. S&R levels tell you where price is likely to bounce or stall, and ignoring them is a fast track to getting stopped out. Bad news: All scripted versions of support and resistance are lacking. You have to do the work. Finding S&R Levels requires that you review multiple factors. Good news: With a little practice, S&R Levels can be confirmed at a glance. Think of support as the floor and resistance as the ceiling. Support = Buyers step in, preventing price from dropping further. Resistance... |

|
| Join our VIP Members Club to get access to our premium indicators including Buy The Dip, Advanced Market Moves and Take Profit. Your VIP membership includes: |
| ✓ Full access to public & private forums ✓ No Ads ✓ Priority community support ✓ Unlimited Postings ✓ Premium thinkorswim indicators ✓ Exclusive strategies, scanners, add-ons ✓ Discord chatroom with Trade Alerts |
| samer800 said: This powerful indicator leverages supertrend analysis to detect market direction while overlaying dynamic Fibonacci levels to highlight potential support, resistance, and optimal trend entry zones. With its straightforward design, it is perfect for traders looking to simplify their workflow and enhance decision-making. |

|
FROM THE ARCHIVES: MAY 2020 |
| BenTen said: I’ve been using it for a while, and I think this is a good indicator. Even though it is prepared for accumulation/distribution recognizing phase, but based on my observations, it shows when the trend begins getting stronger. There are 3 ways to use it. I usually get entry position when: Candle upward before / after cross the zero line Candle downward, but real candle is sideways. This will be best when price is in an oversold area. Candle downward and begin to change from big to small. It is usually followed by significant movement. When down candle with the red real candle is occur, it almost certainly bearish signal. |

|
Last edited by a moderator: