

Trend Trader Buy/Sell Signals, Date & Trend on Interday Charts, Fibonacci Bollinger Bands, and more...! |
| Here on useThinkScript, we dive deep into the latest discussions and highlight the most valuable indicators, set ups, and strategies which could give you the edge in this week's markets. Scroll down to check out this week's must reads, carefully selected by uTS Moderators! |
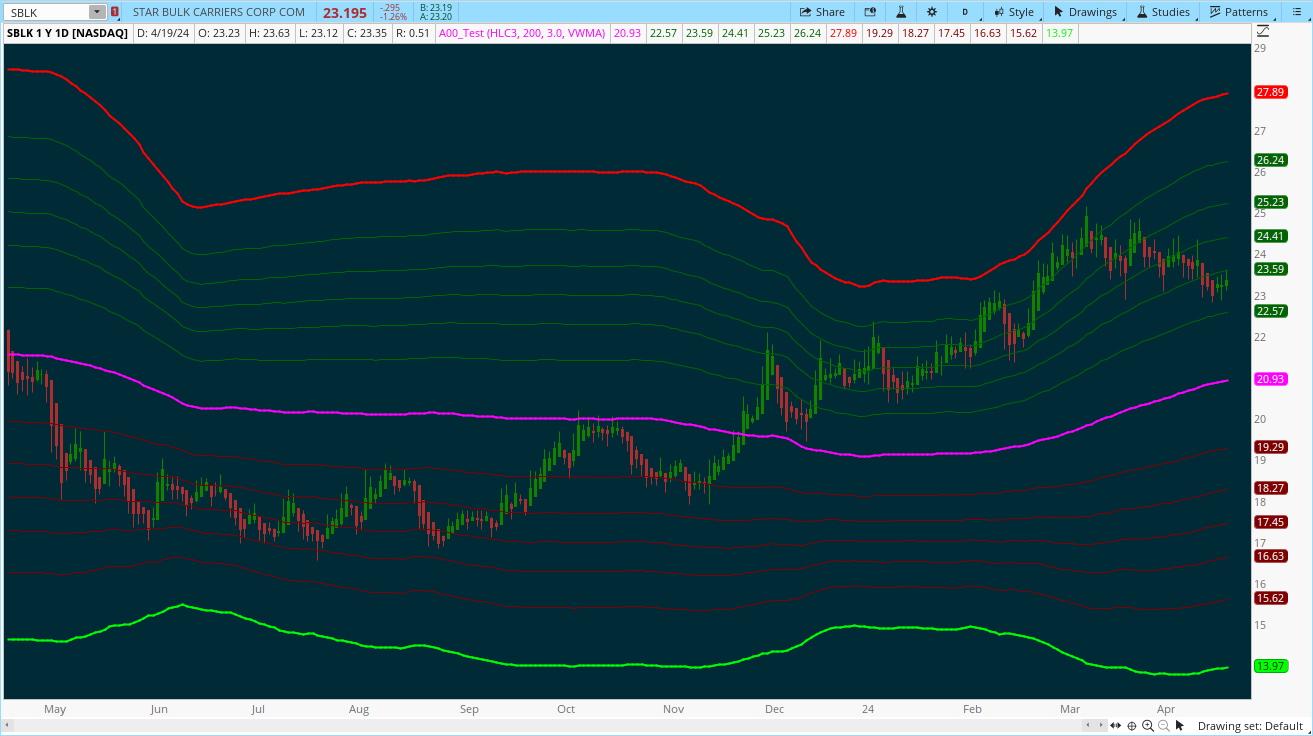
| TPTrades said: These Bollinger bands feature Fibonacci retracements to very clearly show areas of support and resistance. The basis is calculate off of the Volume Weighted Moving Average. The Bands are 3 standard deviations away from the mean. 99.73% of observations should be in this range. |
|
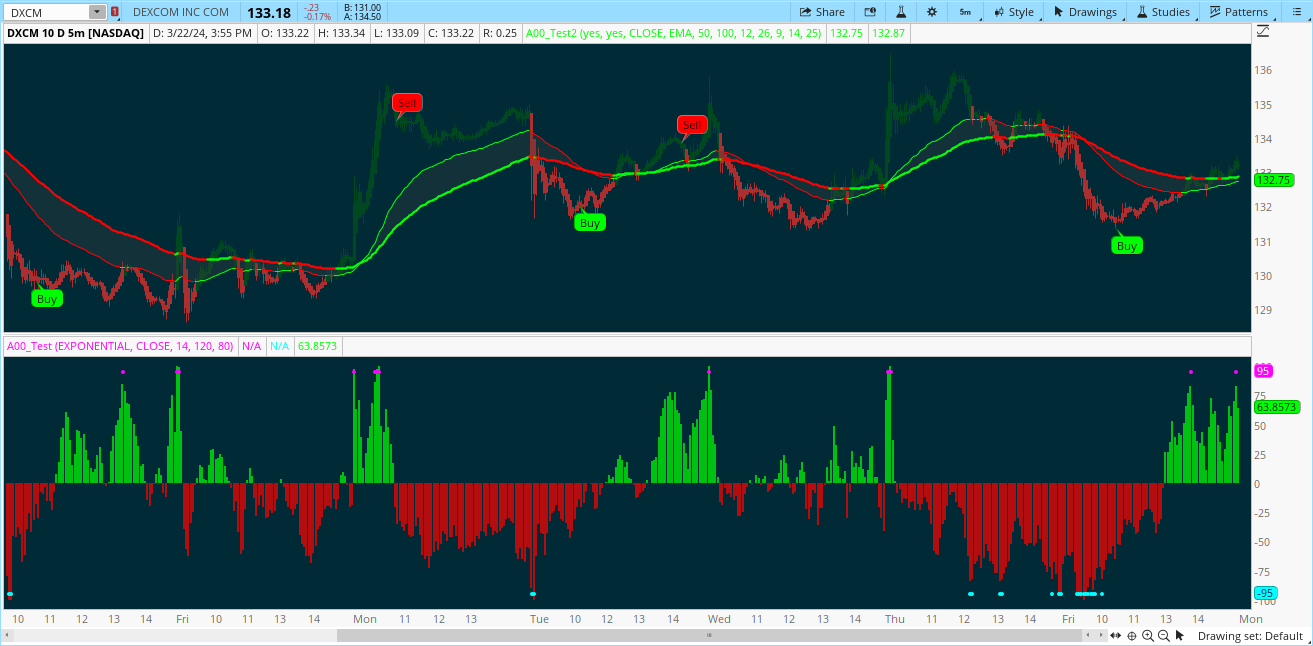
| miklosh13 said: The Script can be used to identify the main trend and take BUY/SELL decisions in the lower time frames. The tool can be applied as follows: Apply the tool to your favorite chart Select the main trend. Go to lower time frames to check the BUY/SELL signals. Example: If the selected main trend is 4 hrs, then go to time frames below 4 hrs to find the entry and exit positions. |

|
AVAILABLE TO VIP MEMBERS ONLY |
useThinkScript said: Interday charts do not display the Month and Day. This makes it difficult to align the date that an event happened with the candles on the chart. 1. this loads as a lower chart. DO NOT CHANGE THIS. It is necessary in order to set range 2. After you have added the study, you MUST drag it to the upper chart. In a bubble, it displays the 1st letter of the month, the day of the month and green if the day closes up otherwise pink. |

|
| Join our VIP Members Club to get access to our premium indicators including Buy The Dip, Advanced Market Moves and Take Profit. Your VIP membership includes: |
| ✓ Full access to public & private forums ✓ No Ads ✓ Priority community support ✓ Unlimited Postings ✓ Premium thinkorswim indicators ✓ Exclusive strategies, scanners, add-ons ✓ Discord chatroom with Trade Alerts |
| whoDAT said: I'm a big fan of ZigZag indicators. A general problem is they are repainters A notable exception is the QQE ZigZag, an indicator that I find very useful. Laguerre filters are fast-acting methods to smooth inputs. John Eulers described a fast Laguerre method to smooth financial market data in his article entitled "Time Warp - Without Space Travel". Speed is good; speed with market data is fast money. The below code uses a Eulers High-Low Laguerre Filter (EHLLF) to find uptrends and downtrends, creating a responsive, non-repainting ZigZag. The plots include the LaguerreZigZag, along with Eulers' Filter and Finite ImpulseResponse (FIR). |

|
FROM THE ARCHIVES |
| DigitsM said: The code in this thread is for the upper chart indicator. The signals look for the MACD cross that occurs when the ADX is above a customizable threshold. Additionally, the MA ribbon is used for visualizing trend and provides dynamic support/resistance. Candle colors change in relation to where price is according to the 50-day MA. |
|
Last edited by a moderator: