
Here are the latest tips and strategies from your uTS Community |
| Here on useThinkScript, we dive deep into the latest discussions and highlight the most valuable indicators, set ups, and strategies which could give you the edge in this week's markets. Scroll down to check out this week's must reads, carefully selected by uTS Moderators! |
| tradelex20 said: This combines the MOST and SuperTrend Indicators. They are very good at trend following systems but conversely their performance is not bright in sideways market conditions like most of the other indicators. Profit Maximizer - PMax tries to solve this problem. PMax combines the powerful sides of MOST (Moving Average Trend Changer) and SuperTrend (ATR price detection) in one indicator. It reduces the number of false signals in sideways and give more reliable trade signals. |

|
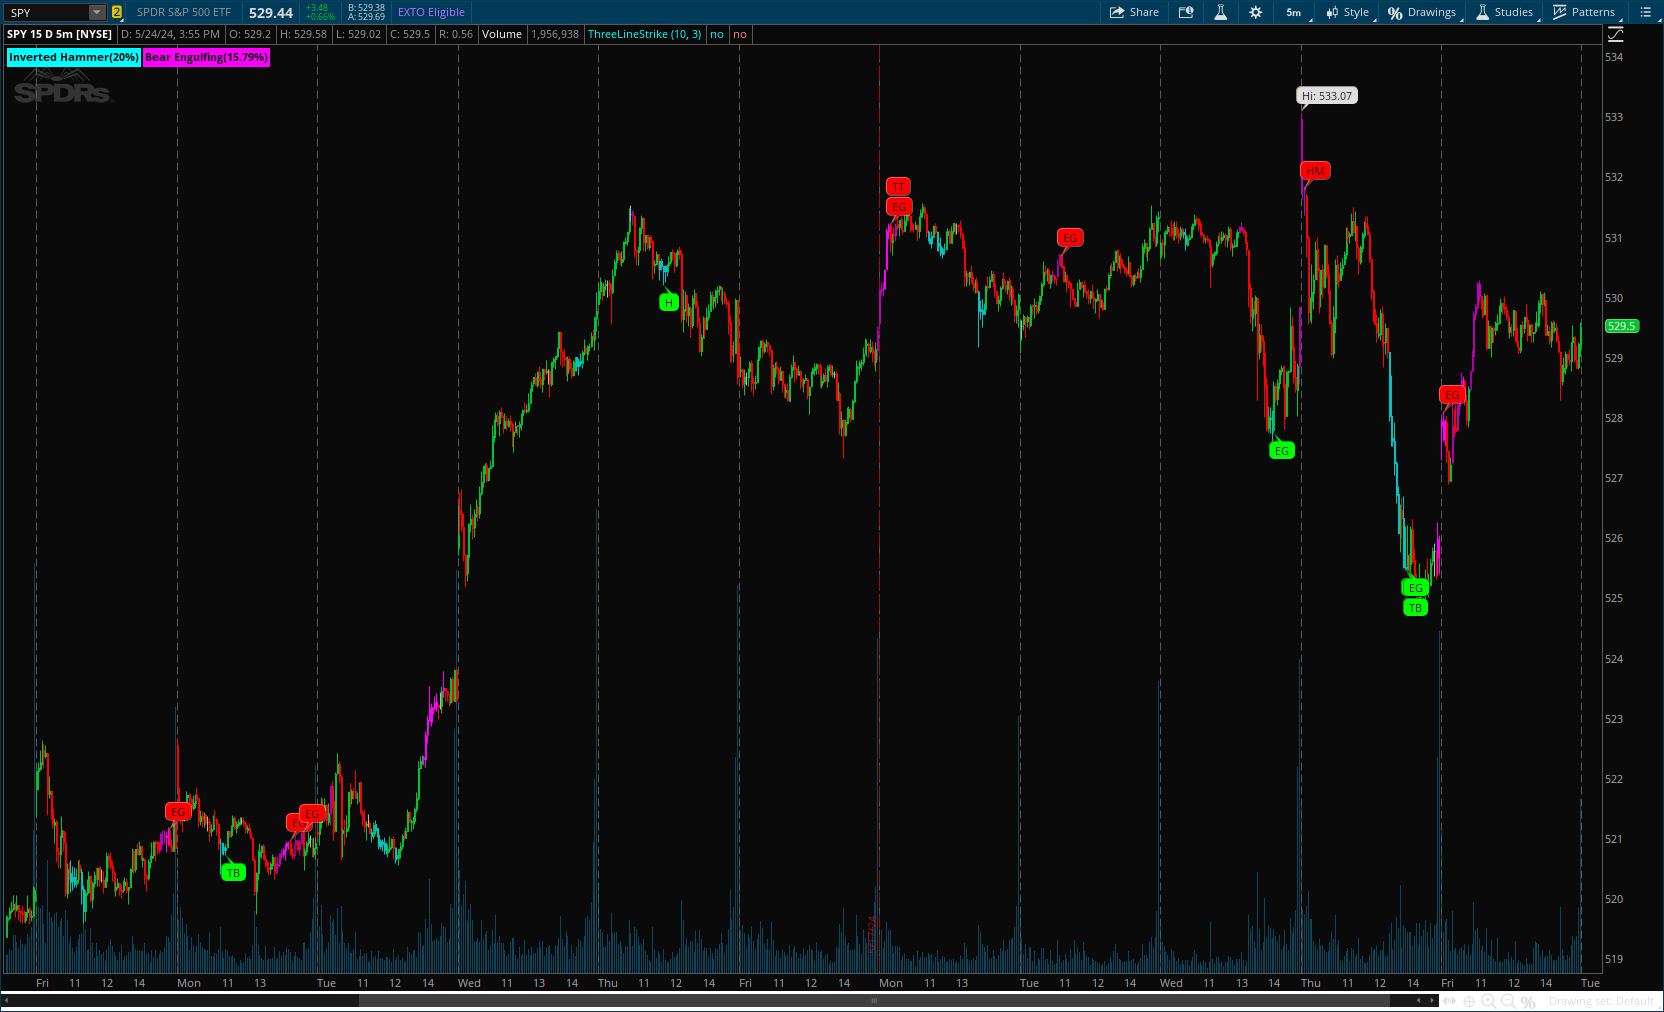
| samer800 said: The Reversal Candlestick Structure indicator detects multiple candlestick patterns occurring when trends are most likely to experience a reversal in real-time. The reversal detection method includes various settings allowing users to adjust the reversal detection algorithm more precisely. A dashboard showing the percentage of patterns detected as reversals is also included. |
|
AVAILABLE TO VIP MEMBERS ONLY |
| MerryDay said: I am calling this a "snippet" of code because it provides the logic but the user needs to decide what sectors they want to display. The current code displays only the sectors that I have been trading. This study displays the change in performance from the previous day of the underlying ETF of selected Sectors as a % difference. This study also compares selected Sectors performance to the overall SPY performance to highlight if that Sector is having an especially strong trending day. |

|
| Join our VIP Members Club to get access to our premium indicators including Buy The Dip, Advanced Market Moves and Take Profit. Your VIP membership includes: |
| ✓ Full access to public & private forums ✓ No Ads ✓ Priority community support ✓ Unlimited Postings ✓ Premium thinkorswim indicators ✓ Exclusive strategies, scanners, add-ons ✓ Discord chatroom with Trade Alerts |
| samer800 said: This tool displays relative volatility and directional trend. Excellent way to pickup diversions and reversals. Length can be lowered to 11 or 13 in settings to show price range. Can be used to identify patterns such as parallel channels and likely direction of price action as pictured below. |

|
FROM THE ARCHIVES: April 2020 |
| chewie76 said: It's gonna get heated up with the Hot Zone indicator! Hope you like it. It is a combination of RSI with IV percentile. The red colored area where IV is greater than RSI is the Hot Zone. Inside the Hot Zone are some colored circles on the midline. A yellow circle is a caution warning... |

|
Last edited by a moderator: