|
| Here on useThinkScript, we dive deep into the latest discussions and highlight the most valuable indicators, set ups, and strategies which could give you the edge in this week's markets. Scroll down to check out this week's must reads, carefully selected by uTS Moderators! |
| cando13579 said: The Chebyshev filters are powerful smoothing techniques that can be used in technical analysis to remove noise from time series data. They offer a sharper transition between the passband and the stopband compared to other filter types, which helps in preserving the essential features of the data while effectively reducing noise. |

|
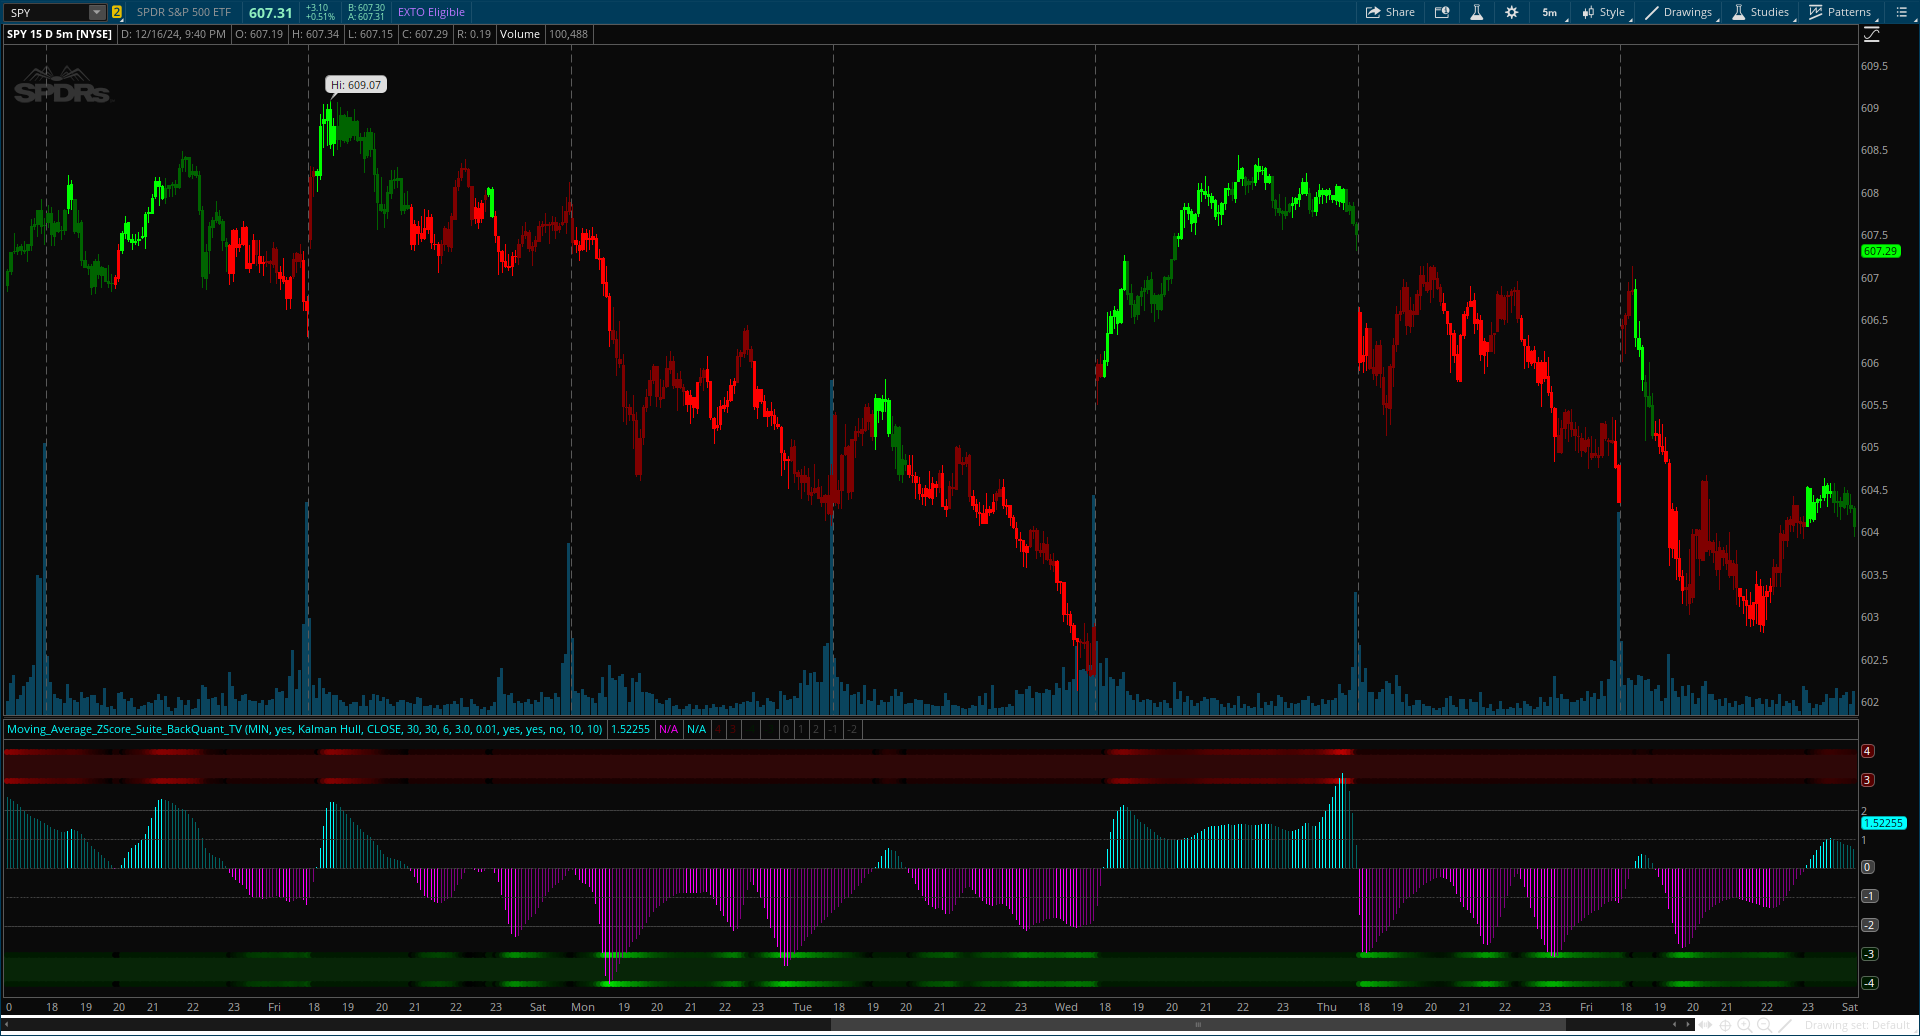
| samer800 said: This indicator transforms selected moving averages into a Z-Score oscillator, providing clear signals for potential buy and sell opportunities. The indicator includes options to choose from eleven different moving average types, each offering unique benefits and characteristics. It also provides additional features such as standard deviation levels, extreme levels, and divergence detection, enhancing its utility in various market conditions. |

|
AVAILABLE TO VIP MEMBERS ONLY |
| MerryDay said: Volume spikes, while attention-grabbing, can often distort meaningful analysis on a chart. Cutting off these spikes helps traders focus on patterns that are more actionable and relevant to understanding market activity. In the latest version of the VIP Anna Coulling Volume Price Analysis indicator, actual volume is not displayed. Instead, outliers and volume spikes exceeding 25% above the moving average are capped. This adjustment ensures that the majority of volume activity remains visible and interpretable, without being overshadowed by extreme, infrequent surges. Key features of this modification: Cyan Lines: Indicate where volume spiked above the cutoff threshold, signaling unusual activity.Yellow Triangles: Mark instances where volume spiked more than one standard deviation above the average. Why this matters: Displaying extreme spikes doesn’t add actionable insight for most traders. These spikes can shrink the rest of the chart, making smaller but important volume changes hard to notice. By removing spikes, the chart highlights meaningful volume activity. |

|
| Join our VIP Members Club to get access to our premium indicators including Buy The Dip, Advanced Market Moves and Take Profit. Your VIP membership includes: |
| ✓ Full access to public & private forums ✓ No Ads ✓ Priority community support ✓ Unlimited Postings ✓ Premium thinkorswim indicators ✓ Exclusive strategies, scanners, add-ons ✓ Discord chatroom with Trade Alerts |
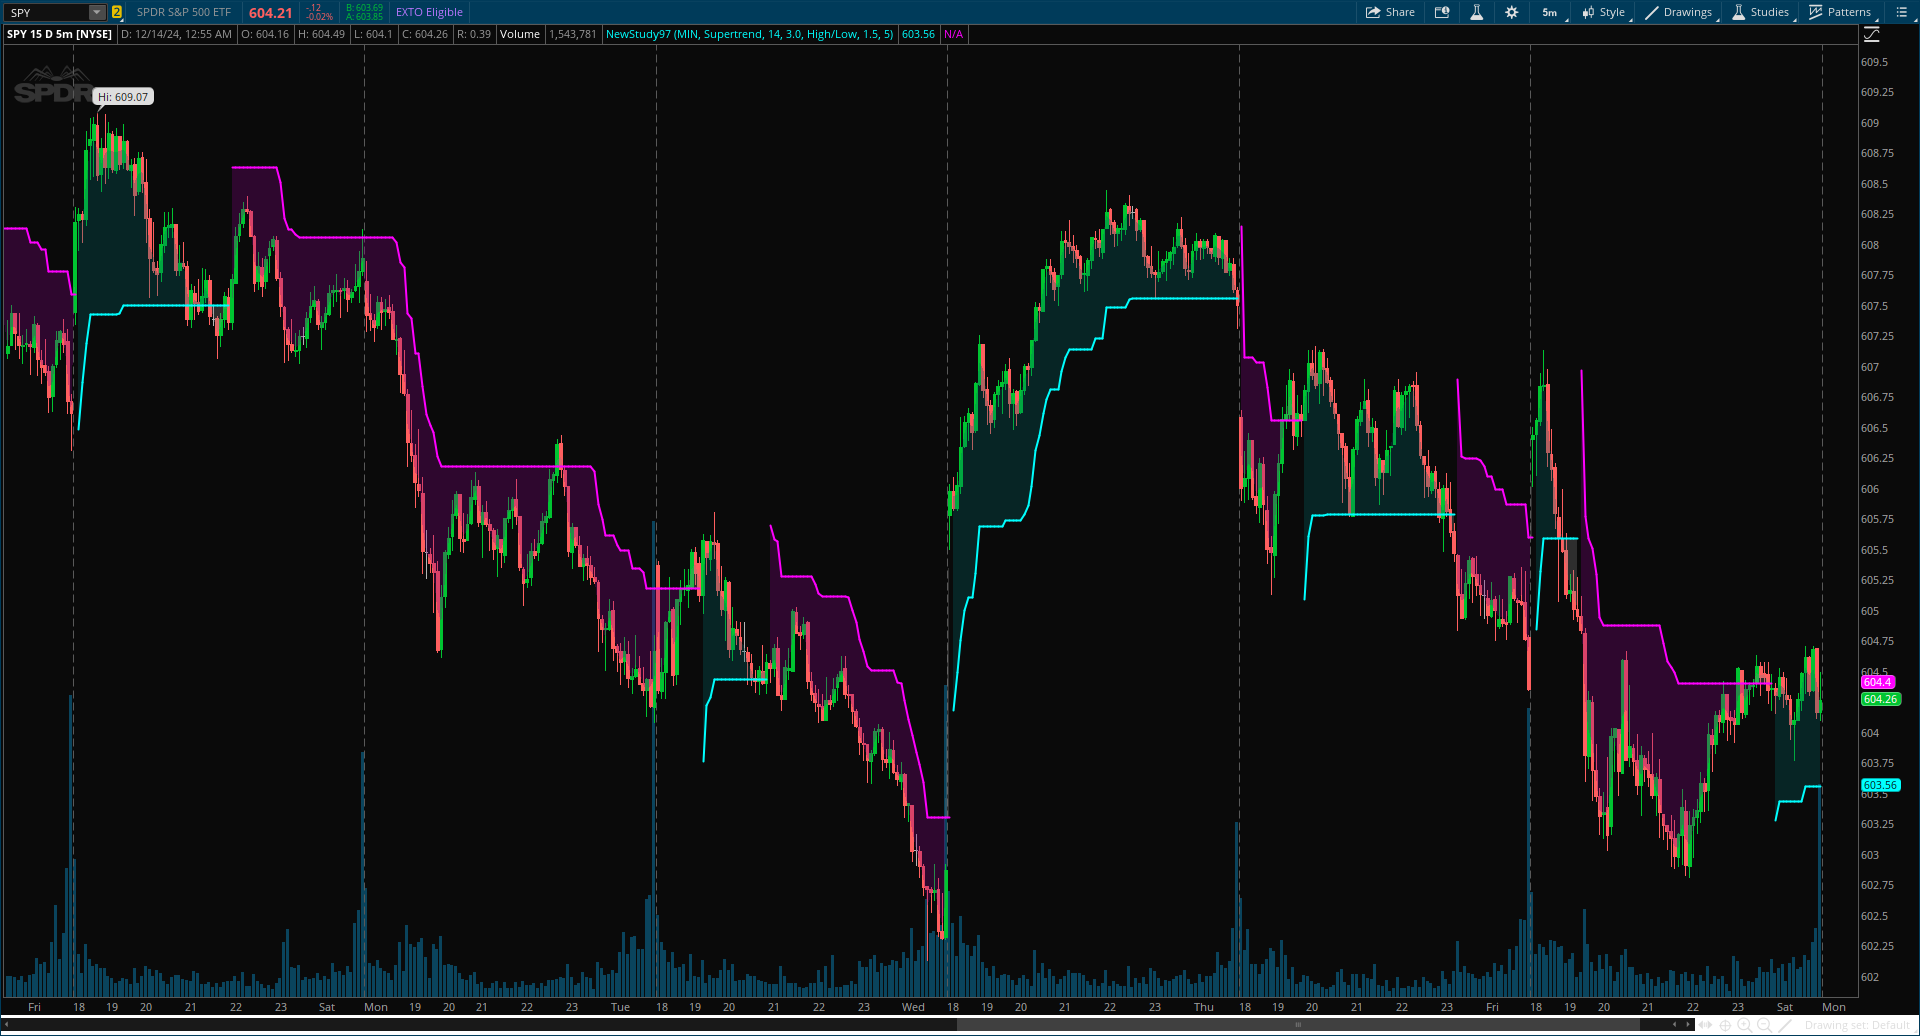
| samer800 said: This script is an enhanced version of the classic Supertrend indicator. It incorporates an additional feature that ensures trend reversals are more reliable by introducing a Fakeout Index Limit and a Fakeout ATR Mult. This helps avoid false trend changes that could occur due to short-term price fluctuations or market noise. |

|
FROM THE ARCHIVES: OCT 2021 |
| mfox said: The cyclic smoothed RSI indicator is an enhancement of the classic RSI , adding
|

|
Last edited:
