|
| Here on useThinkScript, we dive deep into the latest discussions and highlight the most valuable indicators, set ups, and strategies which could give you the edge in this week's markets. Scroll down to check out this week's must reads, carefully selected by uTS Moderators! |
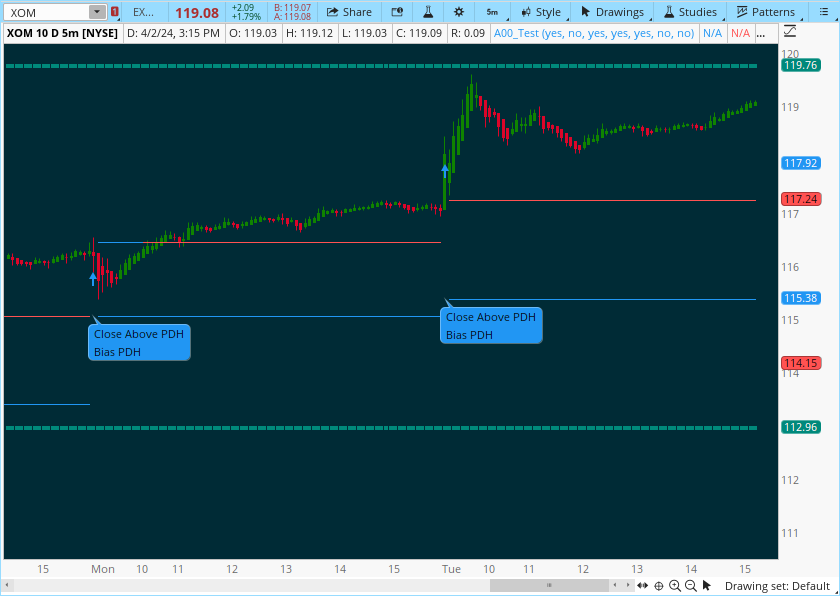
| Glefdar said: This indicator aims to develop a higher timeframe bias. this indicator focuses on one specific method that utilizes previous highs and lows. On the daily timeframe, there are a handful of possible scenarios that we consider: if price closes above its previous day high (PDH), the following day's bias will target PDH; if price trades above its PDH but closes back below it, the following day's bias will target its previous day low (PDL)... |

|
| drasp said: Provides a quick and easy way to gauge the relative strength of the current price compared to the recent trend, allowing traders to identify potential entry and exit points based on whether the price is significantly above or below the moving average, indicating potential overbought or oversold conditions and possible trend reversals. A higher ratio (price significantly above the moving average) suggests a strong uptrend, while a lower ratio (price significantly below the moving average) indicates a downtrend. |

|
AVAILABLE TO VIP MEMBERS ONLY |
| useThinkScript said: The Relative Strength Rating displays the amount of time that an equity has been uptrending on a scale of one to hundred. A stock with a high daily Relative Strength (RSR) Rating, (typically considered to be 80 or higher), signifies a stock that is trending upwards most of the time. Stocks with ratings over 80; tend to be market movers. They have strong fundamentals, they have high liquidity, they are highly correlated to the market, so in times such as these this means they are likely to continue to make higher highs... |

|
| Join our VIP Members Club to get access to our premium indicators including Buy The Dip, Advanced Market Moves and Take Profit. Your VIP membership includes: |
| ✓ Full access to public & private forums ✓ No Ads ✓ Priority community support ✓ Unlimited Postings ✓ Premium thinkorswim indicators ✓ Exclusive strategies, scanners, add-ons ✓ Discord chatroom with Trade Alerts |
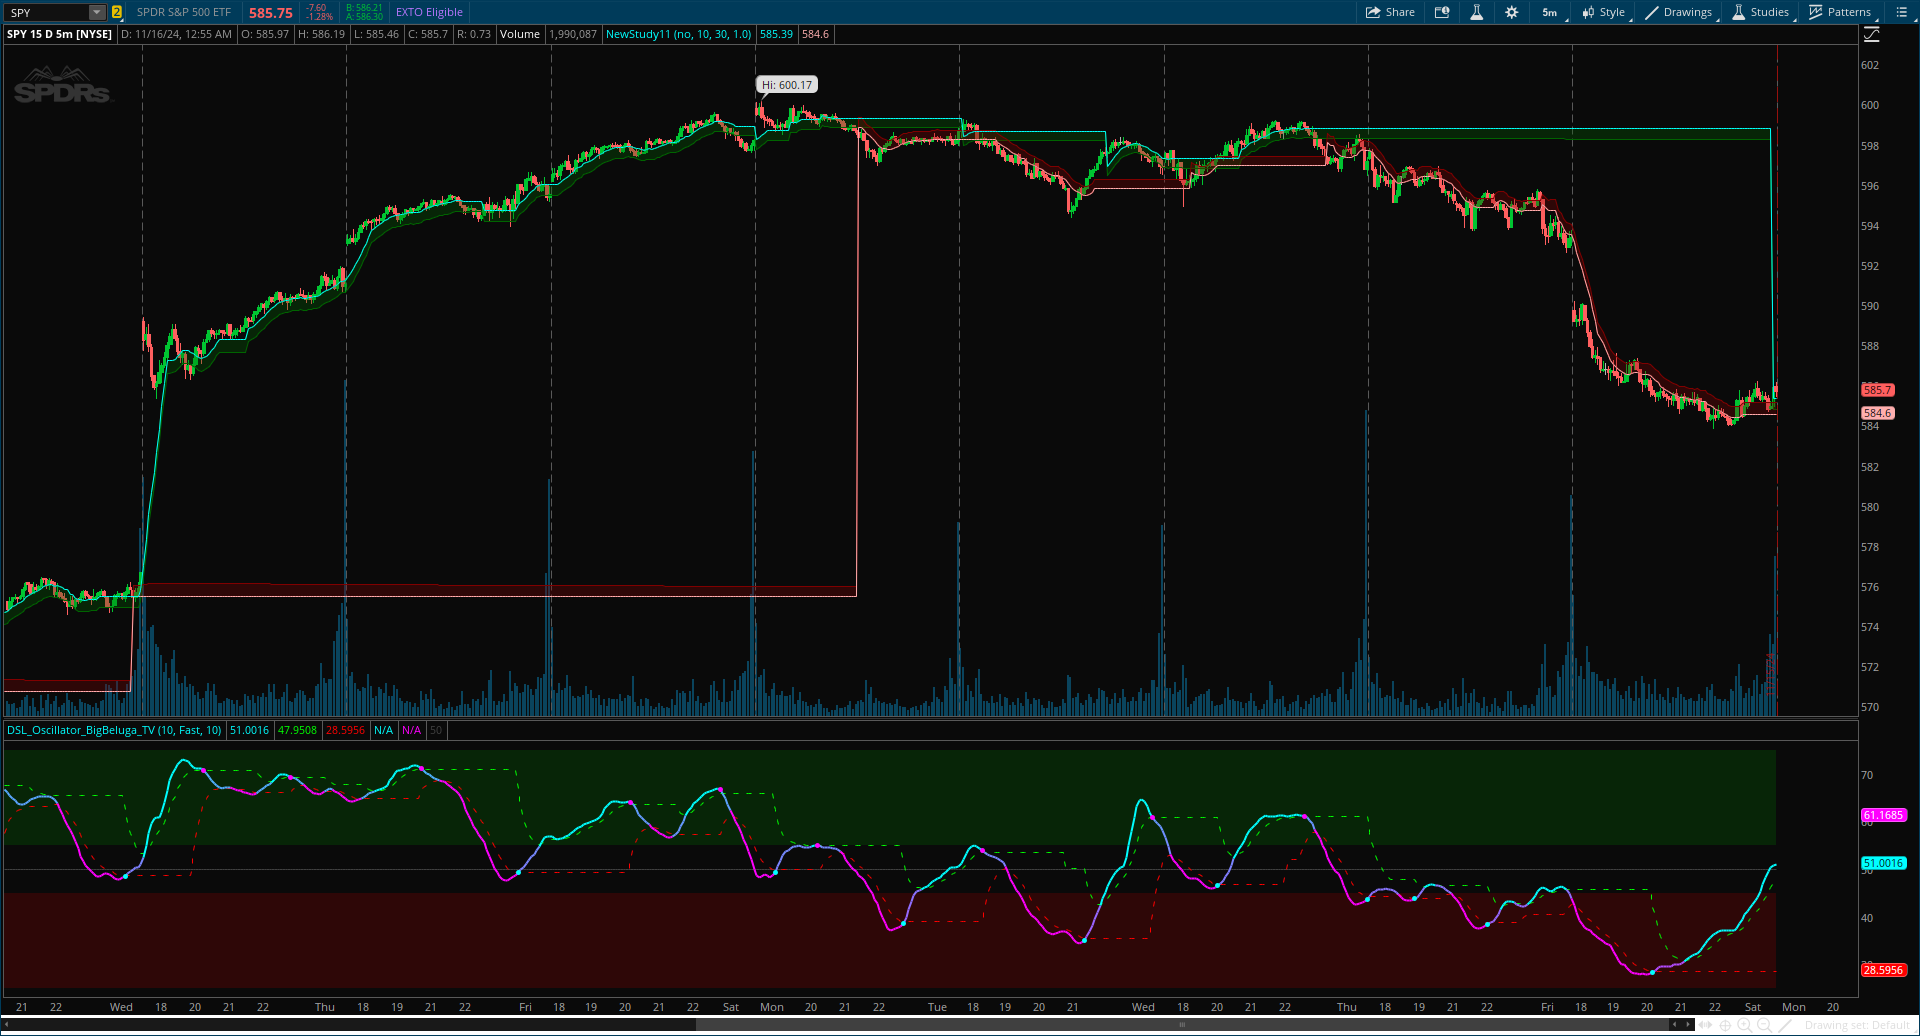
| samer800 said: The DSL Trend Analysis [ChartPrime] indicator utilizes Discontinued Signal Lines (DSL) deployed directly on price, combined with dynamic bands, to analyze the trend strength and momentum of price movements. By tracking the high and low price values and comparing them to the DSL bands, it provides a visual representation of trend momentum, highlighting both strong and weakening phases of market direction. The DSL (Discontinued Signal Lines) Oscillator is an advanced technical analysis tool that combines elements of the Relative Strength Index (RSI), Discontinued Signal Lines, and Zero-Lag Exponential Moving Average (ZLEMA). This versatile indicator is designed to help traders identify trend direction, momentum, and potential reversal points in the market. |

|
FROM THE ARCHIVES: JUN 2020 |
| ccrkk said: Trend Direction Force Index (TDFI) is a technical indicator designed to show the strength and direction of a market trend by combining elements of moving averages with a unique calculation that highlights potential shifts in momentum within the trend, essentially providing a more nuanced view of the market's overall direction and power behind it. It really did a nice job of keeping you out of trades while in a sideways market with the ".05" high/low filter. Positive TDFI value: Indicates an uptrend with strong buying pressure. Negative TDFI value: Shows a downtrend with dominant selling pressure |

|
Last edited by a moderator:
