
|
| Here on useThinkScript, we dive deep into the latest discussions and highlight the most valuable indicators, set ups, and strategies which could give you the edge in this week's markets. Scroll down to check out this week's must reads, carefully selected by uTS Moderators! |
| samer800 said: The Relative Strength Volume-Adjusted Exponential Moving Average (RS VA EMA) is a technical indicator proposed by Vitali Apirine to help identify trends. Its calculation is similar to that of the original EMA, however, the multiplier used in the formula is adjusted for the relative strength of volume. The strength of volume is calculated as the difference between positive and negative volume flows. Volume flow is positive when the specified price is higher than the prior price; it is negative when the specified price is lower than the prior price.[/B][/COLOR] |

|
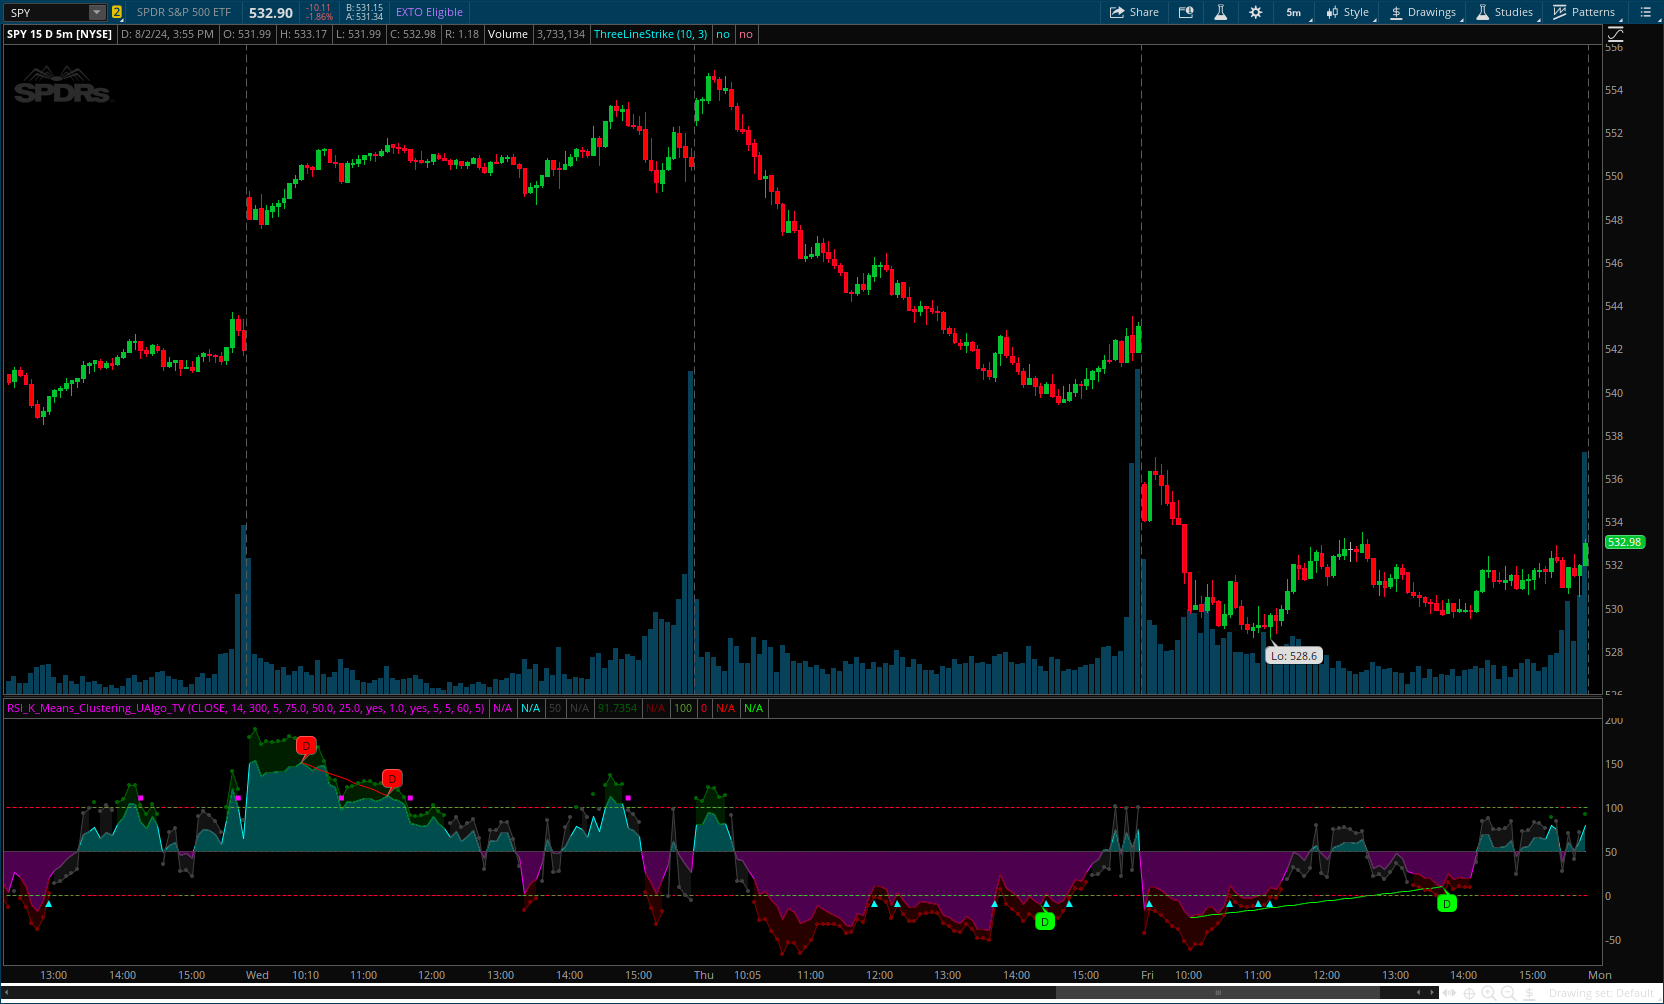
| samer800 said: The "RSI K-Means Clustering" indicator is a technical analysis tool that combines the Relative Strength Index (RSI) with K-means clustering techniques. This approach aims to provide more nuanced insights into market conditions by categorizing RSI values into overbought, neutral, and oversold clusters. |
|
AVAILABLE TO VIP MEMBERS ONLY |
| MerryDay said: Volume Change studies, like all indicators, provide a "heads up" that something interesting might be happening. BUT sometimes when volume change happens in correlation with other price actions, and range/bands/channels and support/resistance; it could be confirmation that something interesting this way comes! Since the beginning of the santa claus rally; I have mostly been trading trends. I prefer my trend entries have volume confirmation. My current favorite Change In Volume Confirming Indicators are... |

|
| Join our VIP Members Club to get access to our premium indicators including Buy The Dip, Advanced Market Moves and Take Profit. Your VIP membership includes: |
| ✓ Full access to public & private forums ✓ No Ads ✓ Priority community support ✓ Unlimited Postings ✓ Premium thinkorswim indicators ✓ Exclusive strategies, scanners, add-ons ✓ Discord chatroom with Trade Alerts |
| samer800 said:: This script analyses divergences for 11 predefined indicators and then draws column on the graph. Red columns for negative divergence (means prices may go down or trend reversal), Lime columns for positive divergences (means prices may go up or trend reversal) The script uses Pivot Points and on each bar it checks divergence between last Pivot Point and current High/Low and if it finds any divergence then immediately draws column. There is no Latency/Lag. |

|
FROM THE ARCHIVES: DEC 2022 |
| MP432 said:: This script is showing the IDR and DR for the regular trading session and for the overnight session based on the rules from the creator of the DR/IDR concept. It works for all major Forex Pairs, BTC, ETH and the US Equity indices. This concept is based on rules and has a 80 % probability to be correct. It should be applied in the 5 Min. Timeframe. |

|
Last edited: