
|
| Here on useThinkScript, we dive deep into the latest discussions and highlight the most valuable indicators, set ups, and strategies which could give you the edge in this week's markets. Scroll down to check out this week's must reads, carefully selected by uTS Moderators! |
| csricksdds said: AGAIG As Good As It Gets Murrey Math Pivot Lines For ThinkOrSwim The Murrey Math lines, created by T.H. Murrey in the 1990s, help spot important price points where the market may reverse or pause (support and resistance levels). It works by dividing market movements into waves with key price levels, based on the concept of "Gann angles." This system can be applied to any market: stocks, commodities, or Forex. By identifying these key levels, traders can make smarter decisions... |

|
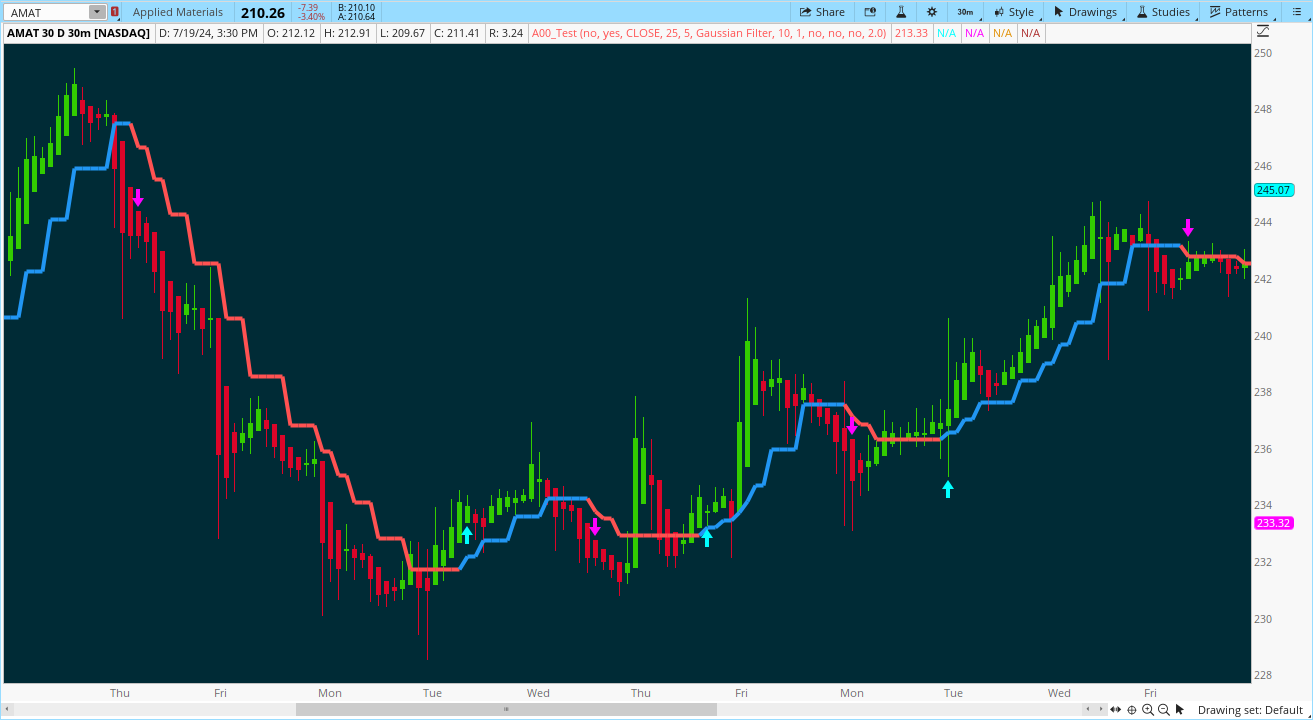
| jmcjkl asked: This is a Gaussian Filter with Standard Deviation Filtering that works for orders (poles) higher than the usual 4 poles that was originally available in Ehlers Gaussian Filter formulas. Because of that, it is a sort of generalized Gaussian filter that can calculate arbitrary (order) pole Gaussian Filter and which makes it a sort of a unique indicator. For this implementation, the practical mathematical maximum is 9poles after which the precision of calculation is useless--the coefficients for levels above 9 poles are so high that the precision loss actually means very little... |
|
AVAILABLE TO VIP MEMBERS ONLY |
| MerryDay said: I believe that Volume Price Analysis can be one of the most powerful indicators on your chart. Anna Coulling's Approach: Turning Points = reversal candle and rising volume and above average volume Bullish = bullish candle (close>open) and then further defines levels of bullishness with volume Bearish = bearish candle (open<close) and uses volume to defines levels of bears. Her approach puts a significant weight onto the trend of a single bar. We know that price and volume do not present a clean trend on any ONE single bar. That it is necessary to view trend through a wider lens... |

|
| Join our VIP Members Club to get access to our premium indicators including Buy The Dip, Advanced Market Moves and Take Profit. Your VIP membership includes: |
| ✓ Full access to public & private forums ✓ No Ads ✓ Priority community support ✓ Unlimited Postings ✓ Premium thinkorswim indicators ✓ Exclusive strategies, scanners, add-ons ✓ Discord chatroom with Trade Alerts |
MCreek said:
In the art of giving back for all I have gained on this site I've been working on a position monitoring and pice target tool that shows trade information, cost, profit/loss, number of shares, long, short, etc. and price targets. I began testing this before the TDA and Schwab merger. There were some bugs in it after the merger, but I think I have them worked out. It was originally coded to only display when you opened a position on a stock, but following the merger it became problematic and wouldn't always display. I fixed it to remain on your chart as a label. It's a pretty straightforward tool to keep track of your positions and price targets... |

|
FROM THE ARCHIVES: SEP 2019 |
| horserider said: This Support/Resistance study is based on pivots and ATR. The Average True Range is a practical tool for drawing lines in order to obtain better orientation in intraday charts. The combination of the ATR levels with the pivot lines often shows that the lines coincide. Change the n to get zones for the time you wish. |

|
Last edited: