QQE (Quantitative Qualitative Estimation) for ThinkorSwim

BenTen

Administrative
Staff member
Staff
VIP
Lifetime
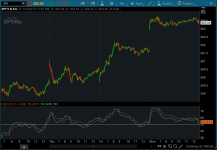
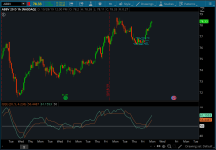
QQE — or Quantitative Qualitative Estimation, is based on a rather complex calculation of the smoothed RSI indicators.

The QQE indicator consists of a smoothed Relative Strength Index (RSI) indicator and two volatility-based trailing levels (fast and slow). The Fast Trailing Level (TL) and Slow TL are constructed by calculating the ATR of the smoothed RSI over n-periods and then further smoothing the ATR using an additional n-periods Wilders smoothing function. This smoothed ATR of RSI is then multiplied by the Fast and Slow ATR Multipliers to calculate the final Fast and Slow Trailing Levels.

qLgSxk3.png

AFNqpDp.png


thinkScript Code

Code:
# QQE Indicator
# Converted by Kory Gill for BenTen at useThinkScript.com
# Original https://www.tradingview.com/script/zwbe2plA-Ghosty-s-Zero-Line-QQE/

declare lower;

input RSI_Period = 20;
input Slow_Factor = 5;
input QQE = 4.236;

def Wilder_Period = RSI_Period * 2 - 1;
def vClose = close;

def rsi = RSI(price = vClose, length = RSI_Period).RSI;
def rsi_ma = MovingAverage(AverageType.EXPONENTIAL, rsi, Slow_Factor);
def atr_rsi = AbsValue(rsi_ma[1] - rsi_ma);
def atr_rsi_ma = MovingAverage(AverageType.EXPONENTIAL, atr_rsi, Wilder_Period);
def dar = MovingAverage(AverageType.EXPONENTIAL, atr_rsi_ma, Wilder_Period) * QQE;

def DeltaFastAtrRsi = dar;
def RSIndex = rsi_ma;
def newshortband =  RSIndex + DeltaFastAtrRsi;
def newlongband = RSIndex - DeltaFastAtrRsi;

def longband = if RSIndex[1] > longband[1] and RSIndex > longband[1]
               then max(longband[1],newlongband)
               else newlongband;

def shortband = if RSIndex[1] < shortband[1] and  RSIndex < shortband[1]
                then min(shortband[1], newshortband)
                else newshortband;

def trend = if Crosses(RSIndex, shortband[1])
            then 1
            else if Crosses(longband[1], RSIndex)
            then -1
            else if !IsNAN(trend[1])
            then trend[1]
            else 1;

def FastAtrRsiTL = if trend == 1
                   then longband
                   else shortband;

plot pFastAtrRsiTL = FastAtrRsiTL;
plot pRsiMa = rsi_ma;
plot line50 = 50;

pFastAtrRsiTL.SetDefaultColor(CreateColor(225,109,47));
pRsiMa.SetDefaultColor(CreateColor(113,225,180));

Learn more about the QQE indicator and how to trade it:
 

Attachments

  • qLgSxk3.png
    qLgSxk3.png
    111.8 KB · Views: 207
  • AFNqpDp.png
    AFNqpDp.png
    101.1 KB · Views: 206

Join useThinkScript to post your question to a community of 21,000+ developers and traders.

per the information, in summary:

if the indicator band is much higher than the level of 50, there is uptrend;
if significantly below the level of 50, there is downward;
if the band fluctuates near level 50 (a little above or below the level), there is flat in the market.
 
Does anyone know if it'd be possible to turn this indicator into a strategy? My knowledge with ThinkScript and writing code is pretty much non-existent, but if someone has any tips/hints or can share a starting place, I can toy around with it.
Buying condition would be where the RSI plot crosses the Fast ATR; selling would be the Fast ATR crossing the RSI plot.

Not sure if it's possible with the issue I've noticed with the scanner, but I wanted to check. Thanks for the reply and again for putting this forum together! I can't speak for everyone, but the indicators, resources, and collaboration from others I've seen have really helped me develop new skills and fine tune others - it's really appreciated!

Sorry for the unending questions on this one, but is there a way to add up/down arrows on the candles themselves when the the RSI crosses the ATR line? Specifically an up arrow where the RSI crosses above the ATR, and a down arrow when the ATR crosses the RSI? I'm striking out on all fronts in trying to get a working scanner/strategy for this one, but I'm loving the signals I've seen on AMM 2.0 combined with this indicator. I've never used ToS support, and I'm not sure what their limitations are, but would they go through the code to assist with questions like this?

If it can't be done, I understand - I just wanted to make sure. It should go without saying, but thanks again for putting the time and effort in to this forum!
 
Last edited by a moderator:
@Barmarrs Add this to the bottom of the script:

Code:
input over_sold = 20;
input over_bought = 80;

plot OverSold = over_Sold;
plot OverBought = over_Bought;
plot UpSignal = if pRSIMA crosses above pFastAtrRsiTL then OverSold else Double.NaN;
plot DownSignal = if pRSIMA crosses below pFastAtrRsiTL then OverBought else Double.NaN;

UpSignal.SetDefaultColor(Color.UPTICK);
UpSignal.SetPaintingStrategy(PaintingStrategy.ARROW_UP);
DownSignal.SetDefaultColor(Color.DOWNTICK);
DownSignal.SetPaintingStrategy(PaintingStrategy.ARROW_DOWN);
 
@BenTen I'm using the TradinView's QQE indicator, and I'd love to have it on Thinkorswim.
Is your 50 line can be compared to TV's 0 or 10 lines?

TV QQE indicator gives you a buy signal only when the lines are crossing 10 not zero.

Sh2Pocy.png


Please could you explain?
 
@Art There are different versions of QQE on TradingView, some are modified to produce slightly different signals using different inputs.
 
When there’s a cross over from the RSI and ATR
Add this Line at the end of the script

AssignPriceColor(if pRsiMa crosses above pFastAtrRsiTL then color.cyan else if pRsiMa crosses below pFastAtrRsiTL then color.orange else if pRsiMa > pFastAtrRsiTL then color.Green else if pRsiMa < pFastAtrRsiTL then color.Red else color.Gray);

AddCloud(pRsiMa, pFastAtrRsiTL , color.Green, color.RED);
 
Last edited:
I'd like to convert the qqe indicator into a strategy to backtest...can someone help?

Long - entry when pRsiMa crosses above pFastAtrRsiTL, exit when price crosses upper band of Keltner channel
Short -entry when pRsiMa crosses below pFastAtrRsiTL, exit when price crosses lower band of Keltner channel
 
Last edited by a moderator:
@kcking here is something to start
Code:
# QQE Indicator
# Converted by Kory Gill for BenTen at useThinkScript.com
# Original https://www.tradingview.com/script/zwbe2plA-Ghosty-s-Zero-Line-QQE/


input RSI_Period = 20;
input Slow_Factor = 5;
input QQE = 4.236;

def Wilder_Period = RSI_Period * 2 - 1;
def vClose = close;

def rsi = RSI(price = vClose, length = RSI_Period).RSI;
def rsi_ma = MovingAverage(AverageType.EXPONENTIAL, rsi, Slow_Factor);
def atr_rsi = AbsValue(rsi_ma[1] - rsi_ma);
def atr_rsi_ma = MovingAverage(AverageType.EXPONENTIAL, atr_rsi, Wilder_Period);
def dar = MovingAverage(AverageType.EXPONENTIAL, atr_rsi_ma, Wilder_Period) * QQE;

def DeltaFastAtrRsi = dar;
def RSIndex = rsi_ma;
def newshortband =  RSIndex + DeltaFastAtrRsi;
def newlongband = RSIndex - DeltaFastAtrRsi;

def longband = if RSIndex[1] > longband[1] and RSIndex > longband[1]
               then max(longband[1],newlongband)
               else newlongband;

def shortband = if RSIndex[1] < shortband[1] and  RSIndex < shortband[1]
                then min(shortband[1], newshortband)
                else newshortband;

def trend = if Crosses(RSIndex, shortband[1])
            then 1
            else if Crosses(longband[1], RSIndex)
            then -1
            else if !IsNAN(trend[1])
            then trend[1]
            else 1;

def FastAtrRsiTL = if trend == 1
                   then longband
                   else shortband;

plot pFastAtrRsiTL = FastAtrRsiTL;
plot pRsiMa = rsi_ma;
plot line50 = 50;

pFastAtrRsiTL.SetDefaultColor(CreateColor(225,109,47));
pRsiMa.SetDefaultColor(CreateColor(113,225,180));

#
# TD Ameritrade IP Company, Inc. (c) 2007-2020
#

input displace = 0;
input factor = 1.5;
input length = 20;
input price = close;
input averageType = AverageType.SIMPLE;
input trueRangeAverageType = AverageType.SIMPLE;

def shift = factor * MovingAverage(trueRangeAverageType, TrueRange(high, close, low), length);

def average = MovingAverage(averageType, price, length);

plot Avg = average[-displace];
Avg.SetDefaultColor(GetColor(1));

plot Upper_Band = average[-displace] + shift[-displace];
Upper_Band.SetDefaultColor(GetColor(8));

plot Lower_Band = average[-displace] - shift[-displace];
Lower_Band.SetDefaultColor(GetColor(5));
# END

addOrder(OrderType.BUY_AUTO, pRsiMa crosses above pFastAtrRsiTL);
addOrder(OrderType.SELL_TO_CLOSE, price > Upper_Band);
addOrder(OrderType.SELL_AUTO, pRsiMa crosses below pFastAtrRsiTL);
addOrder(OrderType.BUY_TO_CLOSE, price < Lower_Band);
 
great job benten, this indicator look pretty good, ben can you add a buy and sell arrow to this indicator please on the candles. thank you very much.
 
@FOTM_8888 Here you go:

Code:
# QQE Indicator
# Converted by Kory Gill for BenTen at useThinkScript.com
# Original https://www.tradingview.com/script/zwbe2plA-Ghosty-s-Zero-Line-QQE/

input RSI_Period = 20;
input Slow_Factor = 5;
input QQE = 4.236;

def Wilder_Period = RSI_Period * 2 - 1;
def vClose = close;

def rsi = RSI(price = vClose, length = RSI_Period).RSI;
def rsi_ma = MovingAverage(AverageType.EXPONENTIAL, rsi, Slow_Factor);
def atr_rsi = AbsValue(rsi_ma[1] - rsi_ma);
def atr_rsi_ma = MovingAverage(AverageType.EXPONENTIAL, atr_rsi, Wilder_Period);
def dar = MovingAverage(AverageType.EXPONENTIAL, atr_rsi_ma, Wilder_Period) * QQE;

def DeltaFastAtrRsi = dar;
def RSIndex = rsi_ma;
def newshortband =  RSIndex + DeltaFastAtrRsi;
def newlongband = RSIndex - DeltaFastAtrRsi;

def longband = if RSIndex[1] > longband[1] and RSIndex > longband[1]
               then max(longband[1],newlongband)
               else newlongband;

def shortband = if RSIndex[1] < shortband[1] and  RSIndex < shortband[1]
                then min(shortband[1], newshortband)
                else newshortband;

def trend = if Crosses(RSIndex, shortband[1])
            then 1
            else if Crosses(longband[1], RSIndex)
            then -1
            else if !IsNAN(trend[1])
            then trend[1]
            else 1;

def FastAtrRsiTL = if trend == 1
                   then longband
                   else shortband;

def pFastAtrRsiTL = FastAtrRsiTL;
def pRsiMa = rsi_ma;
def line50 = 50;

plot UpSignal = if pRSIMA crosses above pFastAtrRsiTL then low else Double.NaN;
plot DownSignal = if pRSIMA crosses below pFastAtrRsiTL then high else Double.NaN;

UpSignal.SetDefaultColor(Color.MAGENTA);
UpSignal.SetPaintingStrategy(PaintingStrategy.ARROW_UP);
DownSignal.SetDefaultColor(Color.CYAN);
DownSignal.SetPaintingStrategy(PaintingStrategy.ARROW_DOWN);
 
QQE Indicator Scan

Code:
# QQE Indicator Scan
# Converted by Kory Gill for BenTen at useThinkScript.com
# Original https://www.tradingview.com/script/zwbe2plA-Ghosty-s-Zero-Line-QQE/
# Pensar - modified into scan with 4 different choices -

input RSI_Period = 20;
input Slow_Factor = 5;
input QQE = 4.236;

def Wilder_Period = RSI_Period * 2 - 1;
def vClose = close;

def rsi = RSI(price = vClose, length = RSI_Period).RSI;
def rsi_ma = MovingAverage(AverageType.EXPONENTIAL, rsi, Slow_Factor);
def atr_rsi = AbsValue(rsi_ma[1] - rsi_ma);
def atr_rsi_ma = MovingAverage(AverageType.EXPONENTIAL, atr_rsi, Wilder_Period);
def dar = MovingAverage(AverageType.EXPONENTIAL, atr_rsi_ma, Wilder_Period) * QQE;

def DeltaFastAtrRsi = dar;
def RSIndex = rsi_ma;
def newshortband =  RSIndex + DeltaFastAtrRsi;
def newlongband = RSIndex - DeltaFastAtrRsi;

def longband = if RSIndex[1] > longband[1] and RSIndex > longband[1]
               then max(longband[1],newlongband)
               else newlongband;

def shortband = if RSIndex[1] < shortband[1] and  RSIndex < shortband[1]
                then min(shortband[1], newshortband)
                else newshortband;

def trend = if Crosses(RSIndex, shortband[1])
            then 1
            else if Crosses(longband[1], RSIndex)
            then -1
            else if !IsNAN(trend[1])
            then trend[1]
            else 1;

def FastAtrRsiTL = if trend == 1 then longband else shortband;

plot CrossAbove = if rsi_ma crosses above FastAtrRsiTL then 1 else 0;
#plot CrossBelow = if rsi_ma crosses below FastAtrRsiTL then 1 else 0;
#plot Above = if rsi_ma > FastAtrRsiTL then 1 else 0;
#plot Below = if rsi_ma < FastAtrRsiTL then 1 else 0;

# end scan

Here's a picture of what the scan is doing - it visually shows each choice that you can scan for.

QQE.png
 
Last edited by a moderator:
@FOTM_8888 Here you go:

Code:
# QQE Indicator
# Converted by Kory Gill for BenTen at useThinkScript.com
# Original https://www.tradingview.com/script/zwbe2plA-Ghosty-s-Zero-Line-QQE/

input RSI_Period = 20;
input Slow_Factor = 5;
input QQE = 4.236;

def Wilder_Period = RSI_Period * 2 - 1;
def vClose = close;

def rsi = RSI(price = vClose, length = RSI_Period).RSI;
def rsi_ma = MovingAverage(AverageType.EXPONENTIAL, rsi, Slow_Factor);
def atr_rsi = AbsValue(rsi_ma[1] - rsi_ma);
def atr_rsi_ma = MovingAverage(AverageType.EXPONENTIAL, atr_rsi, Wilder_Period);
def dar = MovingAverage(AverageType.EXPONENTIAL, atr_rsi_ma, Wilder_Period) * QQE;

def DeltaFastAtrRsi = dar;
def RSIndex = rsi_ma;
def newshortband =  RSIndex + DeltaFastAtrRsi;
def newlongband = RSIndex - DeltaFastAtrRsi;

def longband = if RSIndex[1] > longband[1] and RSIndex > longband[1]
               then max(longband[1],newlongband)
               else newlongband;

def shortband = if RSIndex[1] < shortband[1] and  RSIndex < shortband[1]
                then min(shortband[1], newshortband)
                else newshortband;

def trend = if Crosses(RSIndex, shortband[1])
            then 1
            else if Crosses(longband[1], RSIndex)
            then -1
            else if !IsNAN(trend[1])
            then trend[1]
            else 1;

def FastAtrRsiTL = if trend == 1
                   then longband
                   else shortband;

def pFastAtrRsiTL = FastAtrRsiTL;
def pRsiMa = rsi_ma;
def line50 = 50;

plot UpSignal = if pRSIMA crosses above pFastAtrRsiTL then low else Double.NaN;
plot DownSignal = if pRSIMA crosses below pFastAtrRsiTL then high else Double.NaN;

UpSignal.SetDefaultColor(Color.MAGENTA);
UpSignal.SetPaintingStrategy(PaintingStrategy.ARROW_UP);
DownSignal.SetDefaultColor(Color.CYAN);
DownSignal.SetPaintingStrategy(PaintingStrategy.ARROW_DOWN);
@BenTen would this code work real time with no delay or repaint for daily chart for swing?
 
@tem2005 To determine if a script will repaint, you need to look at the code.
Statements with HighestAll/LowestAll or have fold operations in combination with high/lows have a high probability of repainting.
Because think about it: If a stock hits a low, then it will paint that the condition as true but as the stock continues lower, that low is no longer "the low" so it erases it and states that the new candle is the new low.

In answer to your question, I see none of that logic in this script so no repainting. As far as delays, there is no more lag than other technical indicators. However, repainting indicators are so popular because they are generally much faster while also being unreliable. It is a trade-off.
 
Last edited:
Thread starter Similar threads Forum Replies Date
Xiuying QQE MTF (Multi Timeframe) for ThinkorSwim Indicators 20

Similar threads

Not the exact question you're looking for?

Start a new thread and receive assistance from our community.

87k+ Posts
583 Online
Create Post

Similar threads

Similar threads

The Market Trading Game Changer

Join 2,500+ subscribers inside the useThinkScript VIP Membership Club
  • Exclusive indicators
  • Proven strategies & setups
  • Private Discord community
  • ‘Buy The Dip’ signal alerts
  • Exclusive members-only content
  • Add-ons and resources
  • 1 full year of unlimited support

Frequently Asked Questions

What is useThinkScript?

useThinkScript is the #1 community of stock market investors using indicators and other tools to power their trading strategies. Traders of all skill levels use our forums to learn about scripting and indicators, help each other, and discover new ways to gain an edge in the markets.

How do I get started?

We get it. Our forum can be intimidating, if not overwhelming. With thousands of topics, tens of thousands of posts, our community has created an incredibly deep knowledge base for stock traders. No one can ever exhaust every resource provided on our site.

If you are new, or just looking for guidance, here are some helpful links to get you started.

What are the benefits of VIP Membership?
VIP members get exclusive access to these proven and tested premium indicators: Buy the Dip, Advanced Market Moves 2.0, Take Profit, and Volatility Trading Range. In addition, VIP members get access to over 50 VIP-only custom indicators, add-ons, and strategies, private VIP-only forums, private Discord channel to discuss trades and strategies in real-time, customer support, trade alerts, and much more. Learn all about VIP membership here.
How can I access the premium indicators?
To access the premium indicators, which are plug and play ready, sign up for VIP membership here.
Back
Top