Systematical code from another watery Strategy, but the detail is good, though strangled sometimes by blocks of inst. short-sell trades. Dynamic updates too.
The lines:
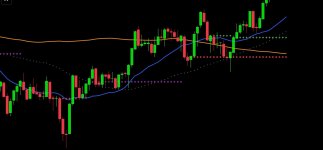
Orange 200 MA
Blue 20 MA
Shallow Grey dash is the 50/50 trade line, the buy /sell differential.
Once the PPS has moved above the Blue and they cross the Orange, a trade may be put on. DYODD!
Red line is the enter short, Green enter long, Purple Exit line (Horizontal)
You'll get chimes, messages for them that flash on the chart, then are loaded to messages.
See chart, right after open:
ACHR is still in down trend, the Red line at open is the sell from premarket (continues),
establishes a straight grey line (trailing stop), and plots another Green(long entry) and Purple (Exit trade)
the changes are due to market changes as it runs through the day, of course.

The lines:
Orange 200 MA
Blue 20 MA
Shallow Grey dash is the 50/50 trade line, the buy /sell differential.
Once the PPS has moved above the Blue and they cross the Orange, a trade may be put on. DYODD!
Red line is the enter short, Green enter long, Purple Exit line (Horizontal)
You'll get chimes, messages for them that flash on the chart, then are loaded to messages.
See chart, right after open:
ACHR is still in down trend, the Red line at open is the sell from premarket (continues),
establishes a straight grey line (trailing stop), and plots another Green(long entry) and Purple (Exit trade)
the changes are due to market changes as it runs through the day, of course.