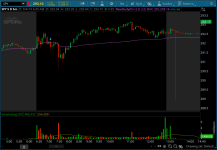
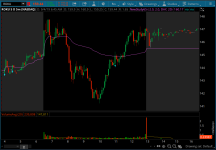
This breakout indicator identifies bullish and bearish trend when a candle crosses VWAP with abnormal volume. The way it defines high volume breakout is by using the Volume Average indicator with the length of 20 simple moving average. You can adjust this settings to your liking once you have the indicator added.
You will see a buy or sell signal when the breakout is detected.


You will see a buy or sell signal when the breakout is detected.
thinkScript Code
Code:
# VWAP Breakout Above Average Volume
# Assembled by BenTen at useThinkScript.com

# You are free to use this code for personal use, and make derivative works from it.
# You are NOT GRANTED permission to use this code (or derivative works) for commercial
# purposes which includes and is not limited to selling, reselling, or packaging with
# other commercial indicators. Headers and attribution in this code should remain as provided,
# and any derivative works should extend the existing headers.

# Start VWAP
input numDevDn = -2.0;
input numDevUp = 2.0;
input timeFrame = {default DAY, WEEK, MONTH};

def cap = getAggregationPeriod();
def errorInAggregation =
    timeFrame == timeFrame.DAY and cap >= AggregationPeriod.WEEK or
    timeFrame == timeFrame.WEEK and cap >= AggregationPeriod.MONTH;
assert(!errorInAggregation, "timeFrame should be not less than current chart aggregation period");

def yyyyMmDd = getYyyyMmDd();
def periodIndx;
switch (timeFrame) {
case DAY:
    periodIndx = yyyyMmDd;
case WEEK:
    periodIndx = Floor((daysFromDate(first(yyyyMmDd)) + getDayOfWeek(first(yyyyMmDd))) / 7);
case MONTH:
    periodIndx = roundDown(yyyyMmDd / 100, 0);
}
def isPeriodRolled = compoundValue(1, periodIndx != periodIndx[1], yes);

def volumeSum;
def volumeVwapSum;
def volumeVwap2Sum;

if (isPeriodRolled) {
    volumeSum = volume;
    volumeVwapSum = volume * vwap;
    volumeVwap2Sum = volume * Sqr(vwap);
} else {
    volumeSum = compoundValue(1, volumeSum[1] + volume, volume);
    volumeVwapSum = compoundValue(1, volumeVwapSum[1] + volume * vwap, volume * vwap);
    volumeVwap2Sum = compoundValue(1, volumeVwap2Sum[1] + volume * Sqr(vwap), volume * Sqr(vwap));
}
def price = volumeVwapSum / volumeSum;
def deviation = Sqrt(Max(volumeVwap2Sum / volumeSum - Sqr(price), 0));

plot VWAP = price;
#plot UpperBand = price + numDevUp * deviation;
#plot LowerBand = price + numDevDn * deviation;

VWAP.setDefaultColor(getColor(0));

# Start Volume
input length = 20;
def Vol = volume;
def VolAvg = Average(volume, length);

def above_volume = Vol > VolAvg;
def bullish_vwap = close crosses above VWAP;

plot bull = above_volume and bullish_vwap;
bull.AssignValueColor(Color.CYAN);
bull.SetPaintingStrategy(PaintingStrategy.BOOLEAN_ARROW_UP);

def bearish_vwap = close crosses below VWAP;
plot bear = above_volume and bearish_vwap;
bear.AssignValueColor(Color.CYAN);
bear.SetPaintingStrategy(PaintingStrategy.BOOLEAN_ARROW_DOWN);
Shareable Link
https://tos.mx/cK8isNAttachments
Last edited:


