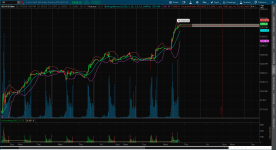
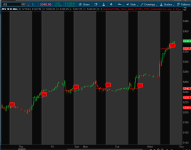
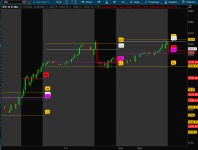
#TPO Profile-Just Lines with Quarter Timeframe Added-Limited to Day, Week, Month and Quarter Timeframes
#Only Displays on the Current Timeframe Selected, the Current and Prior Timeframes
#Best Used on Daily and above charts or Intraday charts with at least 180 days displayed


script tpo {
    input pricePerRowHeightMode = {default AUTOMATIC, TICKSIZE, CUSTOM};
    input customRowHeight = 1.0;
    input timePerProfile = {CHART, MINUTE, HOUR, DAY, WEEK, MONTH, default QUARTER, "OPT EXP", BAR};
    input multiplier = 1;
    input onExpansion = no;
    input profiles = 2;
    input showPointOfControl = yes;
    input showValueArea = yes;
    input valueAreaPercent = 70;
    input opacity = 50;

    def period;
    def yyyymmdd = GetYYYYMMDD();
    def seconds = SecondsFromTime(0);
    def month = GetYear() * 12 + GetMonth();
    def day_number = DaysFromDate(First(yyyymmdd)) + GetDayOfWeek(First(yyyymmdd));
    def dom = GetDayOfMonth(yyyymmdd);
    def dow = GetDayOfWeek(yyyymmdd - dom + 1);
    def expthismonth = (if dow > 5 then 27 else 20) - dow;
    def exp_opt = month + (dom > expthismonth);
    def qtr = (GetMonth() - 1 ) % 3;
    def type = timePerProfile;

    switch (timePerProfile) {
    case CHART:
        period = 0;
    case MINUTE:
        period = Floor(seconds / 60 + day_number * 24 * 60);
    case HOUR:
        period = Floor(seconds / 3600 + day_number * 24);
    case DAY:
        period = CountTradingDays(Min(First(yyyymmdd), yyyymmdd), yyyymmdd) - 1;
    case WEEK:
        period = Floor(day_number / 7);
    case MONTH:
        period = Floor(month - First(month));
    case QUARTER:
        period = qtr == 0 and qtr[1] != 0;
    case "OPT EXP":
        period = exp_opt - First(exp_opt);
    case BAR:
        period = BarNumber() - 1;
}

    def count = CompoundValue(1, if period != period[1] then (count[1] + period - period[1]) % multiplier else count[1], 0);
    def cond = count < count[1] + period - period[1];
    def height;
    switch (pricePerRowHeightMode) {
    case AUTOMATIC:
        height = PricePerRow.AUTOMATIC;
    case TICKSIZE:
        height = PricePerRow.TICKSIZE;
    case CUSTOM:
        height = customRowHeight;
}

    profile tpo = TimeProfile("startNewProfile" = cond, "onExpansion" = onExpansion, "numberOfProfiles" = profiles, "pricePerRow" = height, "value area percent" = valueAreaPercent);
    def con = CompoundValue(1, onExpansion, no);
    def pc  = if IsNaN(tpo.GetPointOfControl()) and con then pc[1] else tpo.GetPointOfControl();
    def hVA = if IsNaN(tpo.GetHighestValueArea()) and con then hVA[1] else tpo.GetHighestValueArea();
    def lVA = if IsNaN(tpo.GetLowestValueArea()) and con then lVA[1] else tpo.GetLowestValueArea();

    def hProfile    = if IsNaN(tpo.GetHighest()) and con then hProfile[1] else tpo.GetHighest();
    def lProfile    = if IsNaN(tpo.GetLowest()) and con then lProfile[1] else tpo.GetLowest();
    def plotsDomain = IsNaN(close) == onExpansion;

    plot POC = if plotsDomain then pc else Double.NaN;
    plot VAH = if plotsDomain then hVA else Double.NaN;
    plot VAL = if plotsDomain then lVA else Double.NaN;
}


input timePerProfile = {DAY, WEEK, MONTH, default QUARTER};
def poc = tpo("time per profile" = timePerProfile);
def vah = tpo("time per profile" = timePerProfile).VAH;
def val = tpo("time per profile" = timePerProfile).VAL;

def ymd      = close(period = timePerProfile);
def candles  = !IsNaN(ymd);
def capture  = candles[1] and ymd != ymd[1] ;
def dayCount = CompoundValue(1, if capture then dayCount[1] + 1 else dayCount[1], 0);
def thisDay  = (HighestAll(dayCount) - dayCount ) ;

plot poc0 = if thisDay == 0 then poc else Double.NaN;
plot val0 = if thisDay == 0 then val else Double.NaN;
plot vah0 = if thisDay == 0 then vah else Double.NaN;

def pc1   = CompoundValue(1, if thisDay == 1 then poc else pc1[1] , poc);
plot poc1 = if thisDay == 0 then pc1 else Double.NaN;
def vh1   = CompoundValue(1, if thisDay == 1 then vah else vh1[1] , vah);
plot vah1 = if thisDay == 0 then vh1 else Double.NaN;
def vl1   = CompoundValue(1, if thisDay == 1 then val else vl1[1] , val);
plot val1 = if thisDay == 0 then vl1 else Double.NaN;

poc0.SetPaintingStrategy(PaintingStrategy.HORIZONTAL);
vah0.SetPaintingStrategy(PaintingStrategy.HORIZONTAL);
val0.SetPaintingStrategy(PaintingStrategy.HORIZONTAL);
poc1.SetPaintingStrategy(PaintingStrategy.DASHES);
vah1.SetPaintingStrategy(PaintingStrategy.DASHES);
val1.SetPaintingStrategy(PaintingStrategy.DASHES);
poc0.SetDefaultColor(Color.RED);
vah0.SetDefaultColor(Color.YELLOW);
val0.SetDefaultColor(Color.YELLOW);
poc1.SetDefaultColor(Color.RED);
vah1.SetDefaultColor(Color.YELLOW);
val1.SetDefaultColor(Color.YELLOW);


input showbubbles = yes;
input bubblemover = 2;
def b  = bubblemover;
def b1 = b + 1;
AddChartBubble(showbubbles and IsNaN(close[b]) and !IsNaN(close[b1]), poc[b1],
(if timePerProfile == timePerProfile.DAY then "D" else if timePerProfile == timePerProfile.WEEK then "W" else if timePerProfile == timePerProfile.MONTH then "M" else "Q") + "POC", Color.RED);
AddChartBubble(showbubbles and IsNaN(close[b]) and !IsNaN(close[b1]), val[b1], (if timePerProfile == timePerProfile.DAY then "D" else if timePerProfile == timePerProfile.WEEK then "W" else if timePerProfile == timePerProfile.MONTH then "M" else "Q") + "VAL", Color.YELLOW);
AddChartBubble(showbubbles and IsNaN(close[b]) and !IsNaN(close[b1]), vah[b1], (if timePerProfile == timePerProfile.DAY then "D" else if timePerProfile == timePerProfile.WEEK then "W" else if timePerProfile == timePerProfile.MONTH then "M" else "Q") + "VAH", Color.YELLOW);
AddChartBubble(showbubbles and IsNaN(close[b]) and !IsNaN(close[b1]), poc1[b1], (if timePerProfile == timePerProfile.DAY then "D" else if timePerProfile == timePerProfile.WEEK then "W" else if timePerProfile == timePerProfile.MONTH then "M" else "Q") + "POC1", Color.RED);
AddChartBubble(showbubbles and IsNaN(close[b]) and !IsNaN(close[b1]), val1[b1], (if timePerProfile == timePerProfile.DAY then "D" else if timePerProfile == timePerProfile.WEEK then "W" else if timePerProfile == timePerProfile.MONTH then "M" else "Q") + "VAL1", Color.YELLOW);
AddChartBubble(showbubbles and IsNaN(close[b]) and !IsNaN(close[b1]), vah1[b1], (if timePerProfile == timePerProfile.DAY then "D" else if timePerProfile == timePerProfile.WEEK then "W" else if timePerProfile == timePerProfile.MONTH then "M" else "Q") + "VAH1", Color.YELLOW);

input showlabels = yes;
AddLabel(showlabels, timePerProfile + " :  Current", Color.WHITE);
AddLabel(showlabels and poc, "POC " + AsText(poc), Color.RED);
AddLabel(showlabels and val, "VAL " + AsText(val), Color.YELLOW);
AddLabel(showlabels and vah, "VAH " + AsText(vah), Color.YELLOW);
AddLabel(showlabels, "  Prior : ", Color.WHITE);
AddLabel(showlabels and poc1, "POC1 " + AsText(poc1), Color.RED);
AddLabel(showlabels and val1, "VAL1 " + AsText(val1), Color.YELLOW);
AddLabel(showlabels and vah1, "VAH1 " + AsText(vah1), Color.YELLOW);


