
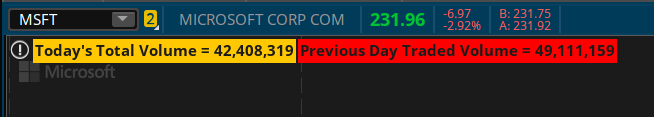
ThinkorSwim label to show the current total volume traded and the total volume of the previous trading day.

Compre Yesterday's Volume vs Today's Volume at Same Time
Volume comparison indicator for ThinkorSwim.")

Code:
declare upper;

input aggregationPeriod = AggregationPeriod.DAY;
def volume = volume(period = aggregationPeriod);
def old_volume = volume(period = aggregationPeriod)[1];
AddLabel(yes, Concat("Today's Total Volume = ", volume), color.orange);
AddLabel(yes, Concat("Previous Day Traded Volume = ", old_volume), color.red);
Compre Yesterday's Volume vs Today's Volume at Same Time
Volume comparison indicator for ThinkorSwim.
Code:
# 09:30 Mobius: Good Morning - Don't have time to stay but wanted to post a volume study that plots a comparison of yesterdays total volume at the same bar and compares an average volume to the same time yesterday.
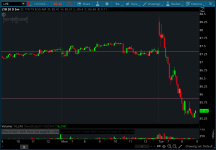
# Volume Comparison
# Plots Yesterdays Total Volume At Same Bar and Average Volume At Same Bar
# Mobius
# V02.06.2018 Posted to Chat Room 07.13.2018
declare on_volume;
input avgLength = 10;
def v = volume;
def vD = volume(period = AggregationPeriod.Day);
def c = close;
def x = BarNumber();
def nan = double.nan;
def RTHbar1 = if GetTime() crosses above RegularTradingStart(GetYYYYMMDD())
then x
else RTHbar1[1];
def RTH = GetTime() >= RegularTradingStart(GetYYYYMMDD()) and
GetTime() <= RegularTradingEnd(GetYYYYMMDD());
def PrevRTHbar1 = if RTHbar1 != RTHbar1[1]
then RTHbar1[1]
else PrevRTHbar1[1];
def indexBar = RTHbar1 - PrevRTHbar1;
plot prevVol = if IsNaN(c)
then nan
else GetValue(v, indexBar);
prevVol.SetPaintingStrategy(PaintingStrategy.HISTOGRAM);
prevVol.SetDefaultColor(CreateColor(75, 75, 75));
prevVol.SetLineWeight(1);
plot Vol = v;
Vol.SetPaintingStrategy(PaintingStrategy.SQUARED_HISTOGRAM);
Vol.AssignValueColor(if close > open then CreateColor(5, 250, 12) else CreateColor(250, 5, 25));
AssignPriceColor(if close > open then CreateColor(5, 250, 12) else CreateColor(250, 5, 25));
def avgPrev = Average(prevVol, avgLength);
def avgCurr = Average(Vol, avgLength);
def prevDailyVol = if RTH and !RTH[1]
then getValue(v, indexBar)
else if RTH
then compoundValue(1, prevDailyVol[1] + GetValue(v, indexBar), GetValue(v, indexBar))
else prevDailyVol[1];
AddLabel(1, "Prev D Vol = " + prevDailyVol +
" Prev Vol avg(" + avgLength + ") = " + Round(avgPrev, 0), prevVol.TakeValueColor());
AddLabel(1, "Current D Vol = " + vD +
" Curr Vol avg(" + avgLength + ") = " + Round(avgCurr, 0), if vD > prevDailyVol
then color.green
else color.red);
# End Code Volume ComparisonAttachments
Last edited by a moderator: