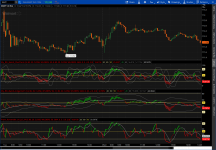
A double RSI indicator with standard deviation bands of the RSI. The very important RSI 50 line and coloring of the RSI lines for strength and weakness with a could to show when the two RSI lines separate. This would indicate a stronger move.
The Midline of the RSI bands works the same as the Market Mover with crossover of the RSI and Midline giving the signals.
The bands and 80 / 20 lines will show when RSI is very strong in one direction or the other. It can be traded the same as BBs by trading from top to bottom band and vice versa, that would be for the most adventurous trader.
The cross of the RSI and Midline would be the next step down in risk for a trade, while that same cross along with a cross of the 50 line would be the conservative trade entry or exit.
The RSI is not an oversold/overbought indicator, it is a strength indicator. So when RSI is high it is telling you the trend is strong, low shows trend is weak. So even when high and falling if it does not break the 50 line the up trend is most likely to continue. So always keep in mind the importance of the 50 line.
I will put up two versions one for scalping types which will match Market Mover signals (without scaling problems and zooming) and one for swing trading types.
Any feedback or questions are welcome.
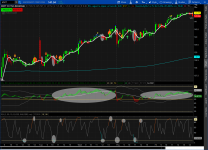
Short term
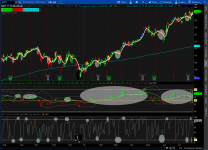
Long term
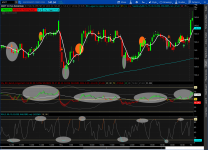
Skeleton of RSI and SMA short term

Short term
https://tos.mx/N6WBa1
Long term
https://tos.mx/lpvzpv
The Midline of the RSI bands works the same as the Market Mover with crossover of the RSI and Midline giving the signals.
The bands and 80 / 20 lines will show when RSI is very strong in one direction or the other. It can be traded the same as BBs by trading from top to bottom band and vice versa, that would be for the most adventurous trader.
The cross of the RSI and Midline would be the next step down in risk for a trade, while that same cross along with a cross of the 50 line would be the conservative trade entry or exit.
The RSI is not an oversold/overbought indicator, it is a strength indicator. So when RSI is high it is telling you the trend is strong, low shows trend is weak. So even when high and falling if it does not break the 50 line the up trend is most likely to continue. So always keep in mind the importance of the 50 line.
I will put up two versions one for scalping types which will match Market Mover signals (without scaling problems and zooming) and one for swing trading types.
Any feedback or questions are welcome.
Short term
Long term
Skeleton of RSI and SMA short term
Short term
https://tos.mx/N6WBa1
Long term
https://tos.mx/lpvzpv