Thinkscript to show label & arrow for largest gain/range since uptrend
Hey guys,
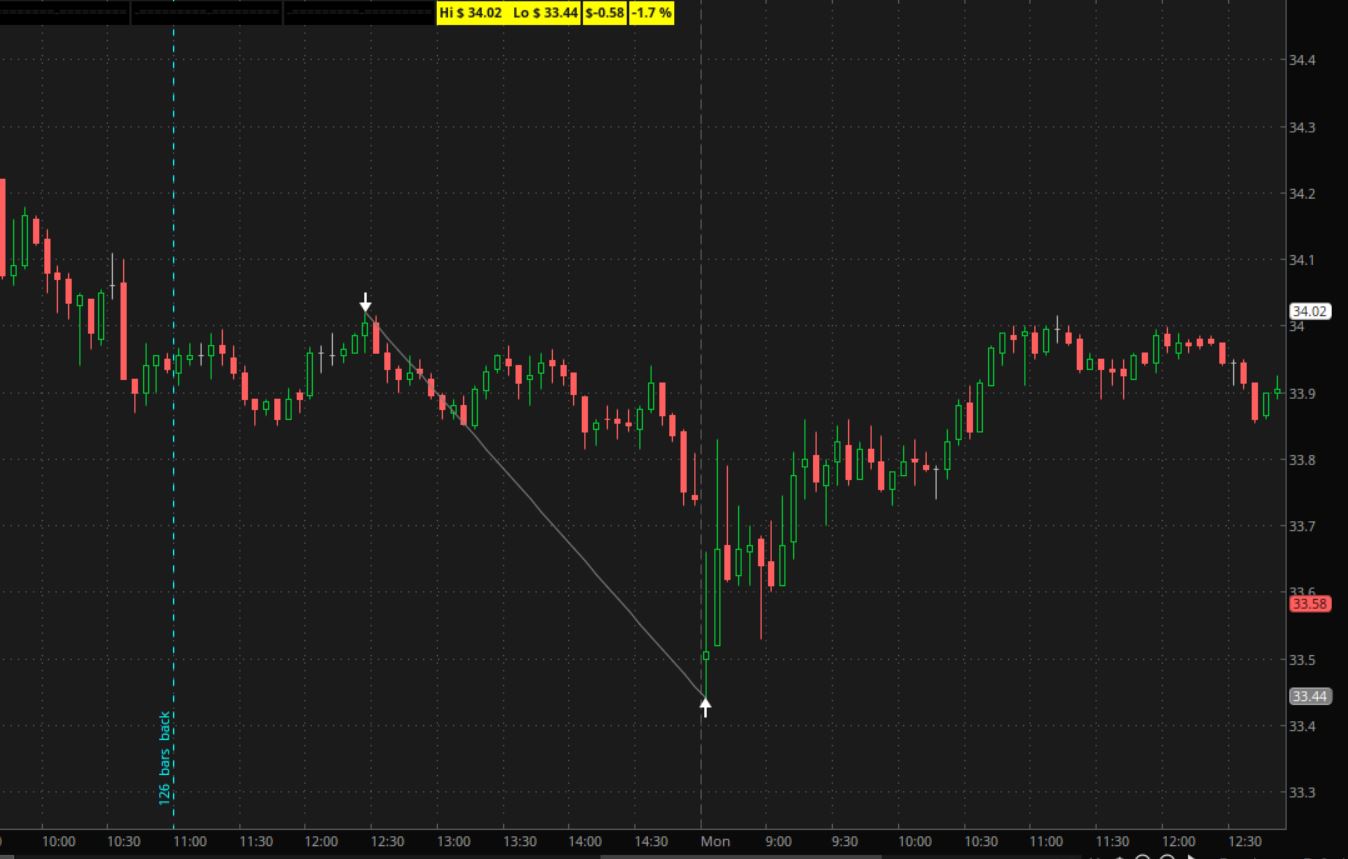
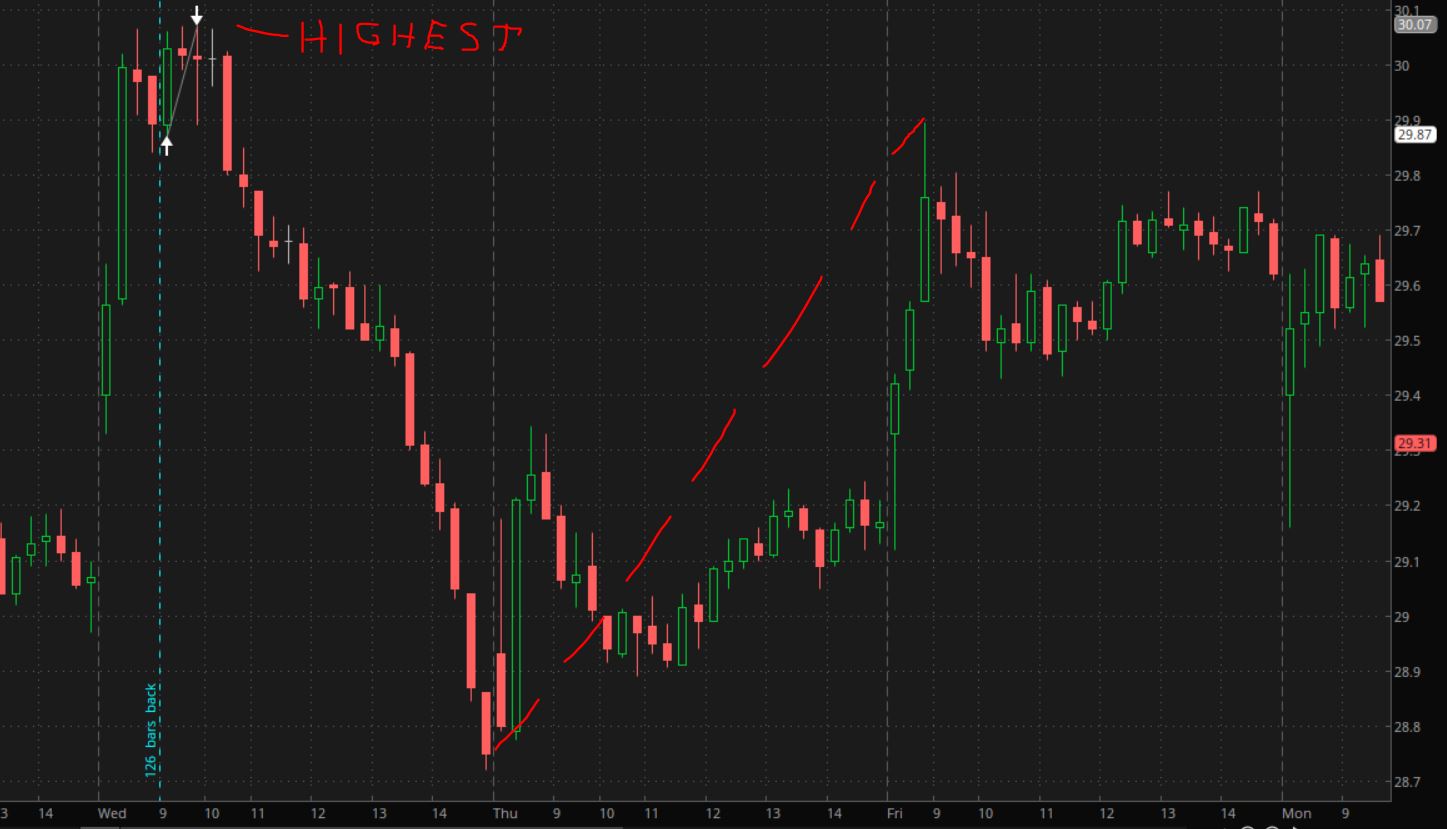
I am working on a new indicator to display lable & arrow for largest gain and largest range candle since 50MA crosses 150MA.
I manage to display the label correctly but somehow my painting strategy ain't showing. Appreciate if anyone can give some advise.
Hey guys,
I am working on a new indicator to display lable & arrow for largest gain and largest range candle since 50MA crosses 150MA.
I manage to display the label correctly but somehow my painting strategy ain't showing. Appreciate if anyone can give some advise.
Code:
def downtrend = SimpleMovingAvg(length = 50) < SimpleMovingAvg(length = 150);

def countuptrend = if downtrend[1] then 1 else countuptrend[1] + 1;

#AddLabel(1, "Bar since 50x150: "+ countuptrend, (if countuptrend >50 then color.DARK_GREEN else color.red));

plot largestgainD = fold i = 0 to countuptrend with p1 do if GetValue(close - close[1],i) > p1 then GetValue(close - close[1],i) else p1;

plot largestrangeD = fold j = 0 to countuptrend  with p2 do if GetValue(high-low,j) > p2 then GetValue(high-low,j) else p2;

#not working here
largestgainD.SetPaintingStrategy(PaintingStrategy.ARROW_UP);

def isLargestgainD = close-close[1] >= largestgainD;
def isLargestrangeD = high-low >= largestrangeD;

AddLabel(1, "Largest Daily Gain: $ "+ largestgainD, (if isLargestgainD and countuptrend > 1 then color.red else color.GRAY));

AddLabel(1, "Largest Daily Range: $ "+ largestrangeD, (if isLargestrangeD and countuptrend > 1 then color.red else color.GRAY));
Last edited by a moderator: