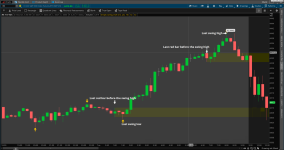
I would like a label that says whether the swing high or swing low was the last condition to be met. Thanks in advance.
input length_10 = 10;
def bn = BarNumber();
def lastBar = HighestAll(if IsNaN(close) then 0 else bn);
def offset = Min(length_10 - 1, lastBar - bn);
def swingLow_10 = low < Lowest(low[1], length_10 - 1) and low == GetValue(Lowest(low, length_10), -offset);
def swingHigh_10 = high > Highest(high[1], length_10 - 1) and high == GetValue(Highest(high, length_10), -offset);
# identify the very last swing high point
def highPointOneBarNumber = HighestAll(if swingHigh_10 then bn else 0);
def highPointOneValue = if bn == highPointOneBarNumber then high else highPointOneValue[1];
Plot Up = SwingLow_10;
Up.SetLineWeight(1);
Up.SetDefaultColor(Color.Orange);
#Up.SetDefaultColor(Color.Uptick);
Up.SetPaintingStrategy(PaintingStrategy.BOOLEAN_ARROW_UP);
#Up.Hide();
Plot Down = SwingHigh_10;
Down.SetLineWeight(1);
Down.SetDefaultColor(Color.Orange);
#Down.SetDefaultColor(Color.Downtick);
Down.SetPaintingStrategy(PaintingStrategy.BOOLEAN_ARROW_DOWN);
#Down.Hide();