Sophisticated Trend-Scoring Scanner For ThinkOrSwim

justAnotherTrader

Active member
VIP
VIP Enthusiast
Prologue: My ambition is to create a scanner that finds stocks that match the picture of what a good chart should look like. I have created multiple scanners for this reason on this site. This scanner is my most ambitious attempt at accomplishing that goal.

What this scanner aims to accomplish:
This scanner is designed to detect stocks that have shown a persistent and strong bullish trend over the past 22 bars. This is based on an amalgamation of three separate indicators that take into account price direction, strength of movement, and trading volume:

  1. Price Direction (Score ID): The scanner first determines whether the closing price has increased or decreased relative to the high or low price from the previous trend period (highest high and lowest low). It gives a score of 1 if the closing price is greater than the previous high and a score of -1 if it's less than the previous low. If the price has not made a significant move, no score is assigned.
  2. Strength of Movement (Score ATR): The scanner considers the strength of the price movement by comparing it to the Average True Range (ATR). If the closing price is higher than the previous high plus the ATR, it assigns a score of 1. Conversely, if the closing price is lower than the previous low minus the ATR, it assigns a score of -1. This scoring system essentially rewards strong moves, either upwards or downwards.
  3. Trading Volume (Score Vol): The third factor the scanner considers is trading volume. It compares the current volume with the average volume over the trend period. If the volume exceeds this average and the closing price is greater than the previous high, the scanner assigns a score of 1. Conversely, if the volume exceeds the average and the closing price is less than the previous low, it assigns a score of -1. No score is assigned if the volume is less than the average.
After the individual scores are calculated for each bar, they are added up to generate an overall trend score. The scanner then sums up these scores over the past 10 bars to create a "Scoresum".

The final scan condition is that the lowest value of the Scoresum in the past 22 bars must be at least 2. This means that the scanner will only identify stocks that have been consistently exhibiting strong bullish trends, both in terms of price movement and trading volume.


What is so great about this scanner:
This scanner is a scoring framework that can be used for many metrics. Also by using scoring the stocks dont have to match a specific metric 100% by our logic. By introducing a closeness effect, we match more real world scenarios and hopefully getting stocks that are more natural looking. Here are a few pluses:
  • The three here, Direction, Strength, and Volume, are just the base 3.
  • We can add scoring on multiple metrics, for instance a score for outperforming a benchmark index, a score for close relative to the 200 sma etc.
  • We can add weights to each score, maybe we care more about bigger moves on bigger volume then we do direction.
  • It can be adjusted for down trending stocks
  • and much more im sure I havent thought about

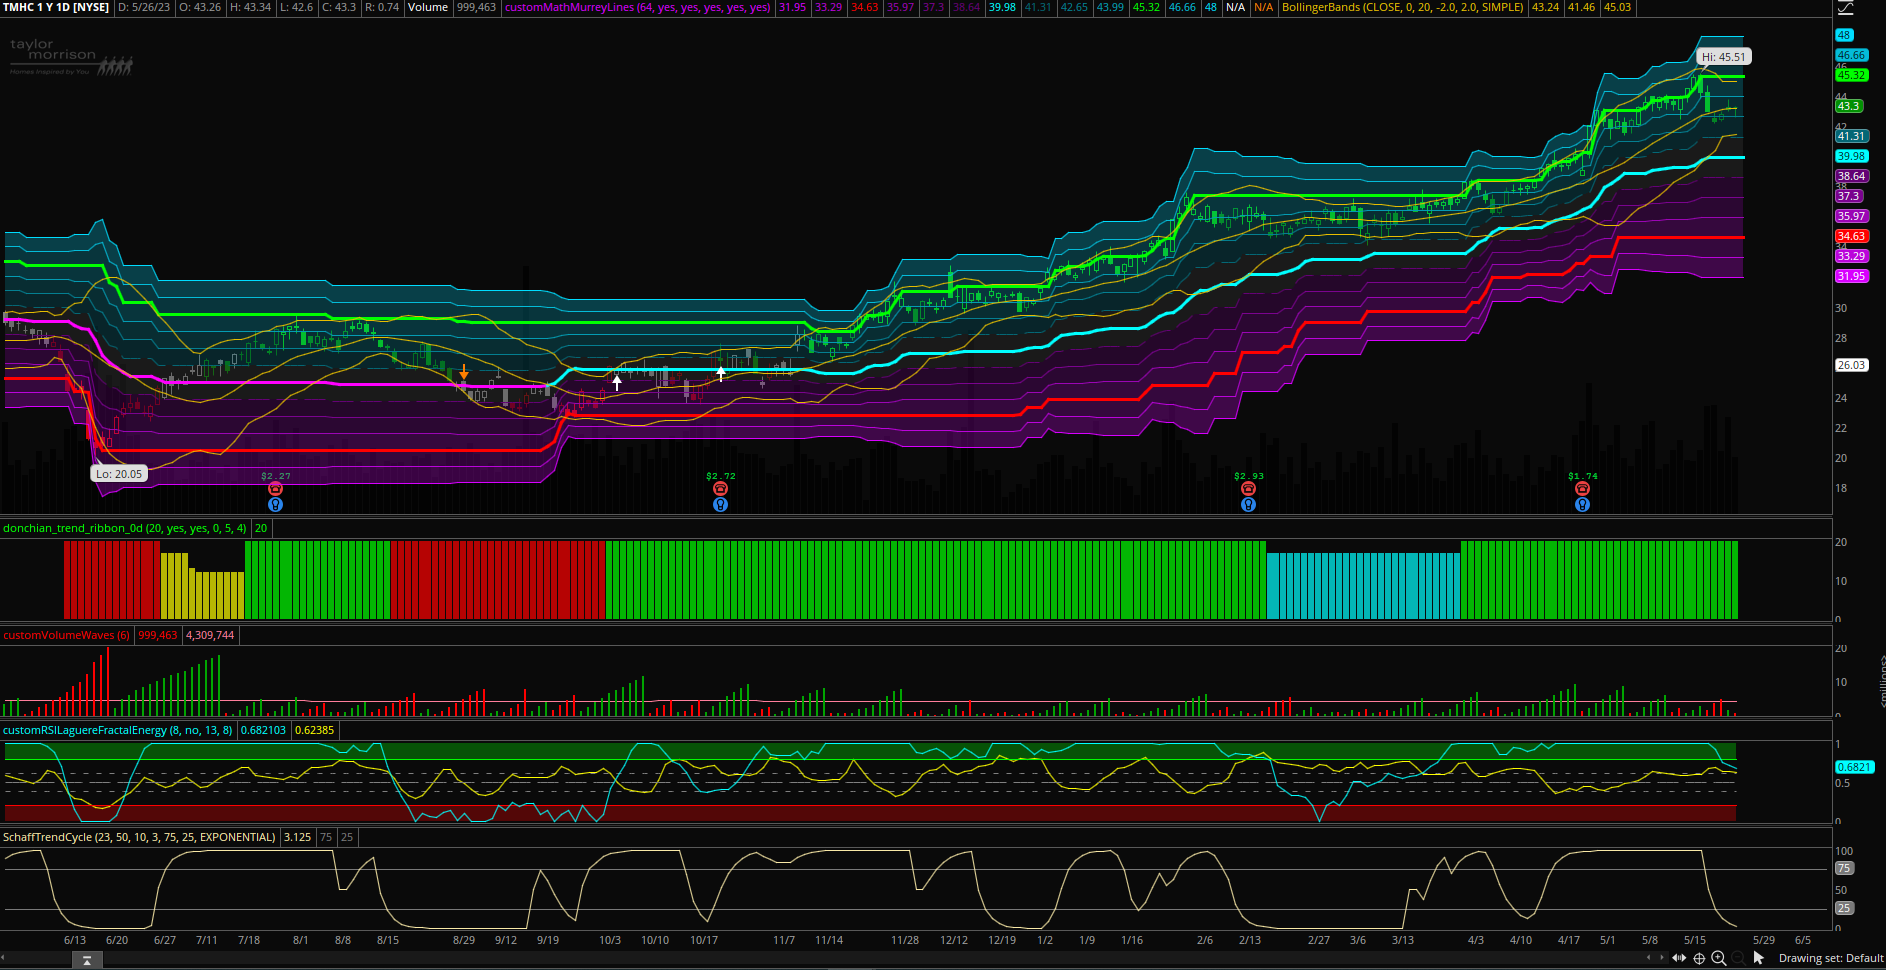
An Example: I ran this scan with the current settings and it returned only 9 stocks. Each one had a chart that I would consider in an uptrend. Consider TMHC, not only is this stock is a strong uptrend, but its also recently pulled back to a local support level:
sjI19CD.png


My additional filters for the scanner:
  • Price above $10
  • Average Volume over 1million
Code:
# Define your inputs
input trendPeriod = 20;
def tlen = if trendPeriod < 10 then 10 else trendPeriod;

# Score condition based on Increasing Deacreasing (scoreID)
def highestHigh = Highest(high, tlen);
def lowestLow = Lowest(low, tlen);
# Calculate ID Score
def scoreID = if close > highestHigh[1] then 1 else if close < lowestLow[1] then -1 else 0;

# Score condition based on strong move days scoreATR
def ATR = Average(TrueRange(high, close, low), 14);
def scoreATR = if close > highestHigh[1] + ATR then 1 else if close < lowestLow[1] - ATR then -1 else 0;

# Score condition based on volume scoreVol
def avgVol = Average(volume, trendPeriod);
def scoreVol = if close > highestHigh[1] and volume > avgVol then 1 else if close < lowestLow[1] and volume > avgVol then -1 else 0;

def trend = scoreID + scoreATR + scoreVol;


# Calculate simplified colorsum by summing up the trends
def Scoresum = Sum(trend, 10);

# The scanning condition
def scanCondition = Lowest(Scoresum[1], 22) >= 2;

# plot the condition to visualize it
plot scan = scanCondition;
 
Last edited:

Join useThinkScript to post your question to a community of 21,000+ developers and traders.

Prologue: My ambition is to create a scanner that finds stocks that match the picture of what a good chart should look like. I have created multiple scanners for this reason on this site. This scanner is my most ambitious attempt at accomplishing that goal.

What this scanner aims to accomplish:
This scanner is designed to detect stocks that have shown a persistent and strong bullish trend over the past 22 bars. This is based on an amalgamation of three separate indicators that take into account price direction, strength of movement, and trading volume:

  1. Price Direction (Score ID): The scanner first determines whether the closing price has increased or decreased relative to the high or low price from the previous trend period (highest high and lowest low). It gives a score of 1 if the closing price is greater than the previous high and a score of -1 if it's less than the previous low. If the price has not made a significant move, no score is assigned.
  2. Strength of Movement (Score ATR): The scanner considers the strength of the price movement by comparing it to the Average True Range (ATR). If the closing price is higher than the previous high plus the ATR, it assigns a score of 1. Conversely, if the closing price is lower than the previous low minus the ATR, it assigns a score of -1. This scoring system essentially rewards strong moves, either upwards or downwards.
  3. Trading Volume (Score Vol): The third factor the scanner considers is trading volume. It compares the current volume with the average volume over the trend period. If the volume exceeds this average and the closing price is greater than the previous high, the scanner assigns a score of 1. Conversely, if the volume exceeds the average and the closing price is less than the previous low, it assigns a score of -1. No score is assigned if the volume is less than the average.
After the individual scores are calculated for each bar, they are added up to generate an overall trend score. The scanner then sums up these scores over the past 10 bars to create a "Scoresum".

The final scan condition is that the lowest value of the Scoresum in the past 22 bars must be at least 2. This means that the scanner will only identify stocks that have been consistently exhibiting strong bullish trends, both in terms of price movement and trading volume.


What is so great about this scanner:
This scanner is a scoring framework that can be used for many metrics. Also by using scoring the stocks dont have to match a specific metric 100% by our logic. By introducing a closeness effect, we match more real world scenarios and hopefully getting stocks that are more natural looking. Here are a few pluses:
  • The three here, Direction, Strength, and Volume, are just the base 3.
  • We can add scoring on multiple metrics, for instance a score for outperforming a benchmark index, a score for close relative to the 200 sma etc.
  • We can add weights to each score, maybe we care more about bigger moves on bigger volume then we do direction.
  • It can be adjusted for down trending stocks
  • and much more im sure I havent thought about

An Example: I ran this scan with the current settings and it returned only 9 stocks. Each one had a chart that I would consider in an uptrend. Consider TMHC, not only is this stock is a strong uptrend, but its also recently pulled back to a local support level:

sjI19CD.png


My additional filters for the scanner:
  • Price above $10
  • Average Volume over 1million
Code:
# Define your inputs
input trendPeriod = 20;
def tlen = if trendPeriod < 10 then 10 else trendPeriod;

# Score condition based on Increasing Deacreasing (scoreID)
def highestHigh = Highest(high, tlen);
def lowestLow = Lowest(low, tlen);
# Calculate ID Score
def scoreID = if close > highestHigh[1] then 1 else if close < lowestLow[1] then -1 else 0;

# Score condition based on strong move days scoreATR
def ATR = Average(TrueRange(high, close, low), 14);
def scoreATR = if close > highestHigh[1] + ATR then 1 else if close < lowestLow[1] - ATR then -1 else 0;

# Score condition based on volume scoreVol
def avgVol = Average(volume, trendPeriod);
def scoreVol = if close > highestHigh[1] and volume > avgVol then 1 else if close < lowestLow[1] and volume > avgVol then -1 else 0;

def trend = scoreID + scoreATR + scoreVol;


# Calculate simplified colorsum by summing up the trends
def Scoresum = Sum(trend, 10);

# The scanning condition
def scanCondition = Lowest(Scoresum[1], 22) >= 2;

# plot the condition to visualize it
plot scan = scanCondition;
can you please share your chart
 
I'm not sure what you're asking for but if it's my indicators the names of them are in the top label section of each one
Extremely interesting, but your indicators are not shown on TOS. Can you do an actual sharing of your chart rather than a screenshot, please?
 
Great work.. could u please share this chart setup.
can you please share your chart
I'm not sure what you're asking for but if it's my indicators the names of them are in the top label section of each one

Extremely interesting, but your indicators are not shown on TOS. Can you do an actual sharing of your chart rather than a screenshot, please?
It's not identical because I have removed the Donchian Trend Channels and added a few things. All indicators that are not native to thinkorswim can be found using the usethinkscript search bar.

My Setup:
https://tos.mx/vYZaZzj
 
Last edited by a moderator:

Similar threads

Not the exact question you're looking for?

Start a new thread and receive assistance from our community.

87k+ Posts
343 Online
Create Post

Similar threads

Similar threads

The Market Trading Game Changer

Join 2,500+ subscribers inside the useThinkScript VIP Membership Club
  • Exclusive indicators
  • Proven strategies & setups
  • Private Discord community
  • ‘Buy The Dip’ signal alerts
  • Exclusive members-only content
  • Add-ons and resources
  • 1 full year of unlimited support

Frequently Asked Questions

What is useThinkScript?

useThinkScript is the #1 community of stock market investors using indicators and other tools to power their trading strategies. Traders of all skill levels use our forums to learn about scripting and indicators, help each other, and discover new ways to gain an edge in the markets.

How do I get started?

We get it. Our forum can be intimidating, if not overwhelming. With thousands of topics, tens of thousands of posts, our community has created an incredibly deep knowledge base for stock traders. No one can ever exhaust every resource provided on our site.

If you are new, or just looking for guidance, here are some helpful links to get you started.

What are the benefits of VIP Membership?
VIP members get exclusive access to these proven and tested premium indicators: Buy the Dip, Advanced Market Moves 2.0, Take Profit, and Volatility Trading Range. In addition, VIP members get access to over 50 VIP-only custom indicators, add-ons, and strategies, private VIP-only forums, private Discord channel to discuss trades and strategies in real-time, customer support, trade alerts, and much more. Learn all about VIP membership here.
How can I access the premium indicators?
To access the premium indicators, which are plug and play ready, sign up for VIP membership here.
Back
Top