
Tried to enter code got an error msg saying it was too complexHi, I'm new here.
I really wanted to try out a Smoothed Heiken-Ashi study for TOS, since it is not available in the default program I looked for a script online, which brought me here. I edited the study from page 1 by HoboTheClown/blt to get the green ha-candles working as I expected. I don't do much scripting but I thought others might find it useful.
Code:# Heikin Ashi Smoothed # HoboTheClown / blt # 9.15.2016 # HoboTheClown: I recently found a code for smoothed heiken ashi bars, # however for some reason all the bars are displayed as one color (going up or down). # # blt: Modified the code and replaced the addchart code at the bottom, # you should now see proper coloring. This is how that was coded to plot # as an overlay to the chart candlesticks. That is two sets of candles, # with different coloring for each. If you have the heikin ashi candle # coloring code on your chart, then they will likely appear the same color. #Update that "fixes" the green candles. #JTP #02/7/2021 input period = 20; input hideCandles = Yes; #Now functional - JTP input candleSmoothing = {default Valcu, Vervoort}; DefineGlobalColor("RisingMA", color.green); DefineGlobalColor("FallingMA", color.red); input movingAverageType = {Simple, default Exponential, Weighted, Hull, Variable, TEMA}; def openMA; def closeMA; def highMA; def lowMA; switch (movingAverageType) { case Simple: openMA = compoundValue(1, Average(open, period), open); closeMA = compoundValue(1, Average(close, period), close); highMA = compoundValue(1, Average(high, period), high); lowMA = compoundValue(1, Average(low, period), low); case Exponential: openMA = compoundValue(1, ExpAverage(open, period), open); closeMA = compoundValue(1, ExpAverage(close, period), close); highMA = compoundValue(1, ExpAverage(high, period), high); lowMA = compoundValue(1, ExpAverage(low, period), low); case Weighted: openMA = compoundValue(1, WMA(open, period), open); closeMA = compoundValue(1, WMA(close, period), close); highMA = compoundValue(1, WMA(high, period), high); lowMA = compoundValue(1, WMA(low, period), low); Case Hull: openMA = compoundValue(1, HullMovingAvg(open, period), open); closeMA = compoundValue(1, HullMovingAvg(close, period), close); highMA = compoundValue(1, HullMovingAvg(high, period), high); lowMA = compoundValue(1, HullMovingAvg(low, period), low); case variable: openMA = compoundValue(1, VariableMA(open, period), open); closeMA = compoundValue(1, VariableMA(close, period), close); highMA = compoundValue(1, VariableMA(high, period), high); lowMA = compoundValue(1, VariableMA(low, period), low); case TEMA: openMA = compoundValue(1, TEMA(open, period), open); closeMA = compoundValue(1, TEMA(close, period), close); highMA = compoundValue(1, TEMA(high, period), high); lowMA = compoundValue(1, TEMA(low, period), low); } hidePricePlot(hideCandles); def haOpen; def haClose; switch(candleSmoothing) { case Valcu: haOpen = CompoundValue(1, ( (haOpen[1] + (openMA[1] + highMA[1] + lowMA[1] + closeMA[1]) /4.0)/2.0), open); haClose = ((OpenMA + HighMA + LowMA + CloseMA)/4.0) ; case Vervoort: haOpen = CompoundValue(1, ( (haOpen[1] + (openMA[1] + highMA[1] + lowMA[1] + closeMA[1]) /4.0)/2.0), open); haClose = ((((OpenMA + HighMA + LowMA + CloseMA)/4.0) + haOpen + Max(HighMA, haOpen) + Min(LowMA, haOpen))/4.0); } plot o = haOpen + 0; o.hide(); ### Wicks and Shadows def haLow = min(lowMA, haOpen); def haHigh = max(highMA,haOpen); ### NO LONGER SUPPORTED BY TOS ### ### AddChart(high = haHigh, low = haLow, open = o, close = haclose, type = ChartType.CANDLE, growColor = GlobalColor("RisingMA"), fallColor = GlobalColor("FallingMA"), neutralColor = color.gray); #Red Candlesticks -----------------------------------------------------------------| input charttype = ChartType.CANDLE; def haOpen_fall = if haOpen>haClose then haOpen else double.nan; def haHigh_fall = if haOpen>=haClose then haHigh else double.nan; def haLow_fall = if haOpen>=haClose then haLow else double.nan; def haClose_fall = if haOpen>=haClose then haClose else double.nan; AddChart(growColor = Color.red, fallColor = Color.green, neutralColor = Color.current, high = haHigh_fall, low = haLow_fall, open = haOpen_fall, close = haClose_fall , type = ChartType.CANDLE); #Green Candlesticks -----------------------------------------------------------------| #Removed and/or replaced - JTP #def HAclose1 = if haOpen<=haClose # then hahigh # else double.nan; #def HAclose1 = ohlc4 -1; #def HAopen1 = if haopen<=haclose # then haclose # then CompoundValue(1, (HAopen[1] + HAclose[1]) /2, (open[1] + close[1]) / 2) # else double.nan; def haOpen_rise = if haOpen<haClose then haClose else double.nan; def haHigh_rise = if haOpen<=haClose then haHigh else double.nan; def haLow_rise = if haOpen<=haClose then haLow else double.nan; def haClose_rise = if haOpen<=haClose then haOpen else double.nan; AddChart(growColor = Color.green, fallColor = Color.red, neutralColor = Color.current, high = haHigh_rise, low = haLow_rise, open = haOpen_rise, close = HAclose_rise, type = ChartType.CANDLE); # End Study ##############################################################################

You are using an out of date browser. It may not display this or other websites correctly.
You should upgrade or use an alternative browser.
You should upgrade or use an alternative browser.
Smoothed Heikin-Ashi for ThinkorSwim
- Thread starter chillc15
- Start date
Worked fine when I entered the code, like the way it looks at first glance. Any such code will usually give you a complex message.Tried to enter code got an error msg saying it was too complex
I found this alternative version of the heikin ashi smoothed and was curious as to others thoughts on this. It seems to be a cleaner version.
https://tos.mx/D3cQCON
Rich (BB code):# TS_HeikinAshiSmoothed # http://www.thinkscripter.com # [email protected] # Last Update 30 June 2013 ### YOU MUST HAVE THE STYLE SETTING FIT STUDIES ENABLED ### #hint: The style setting Fit Studies must be enabled to use these bars. input period = 21; input hideCandles = NO; input candleSmoothing = {default Valcu, Vervoort}; DefineGlobalColor("RisingMA", color.blue); DefineGlobalColor("FallingMA", color.red); input movingAverageType = {default TEMA, Exponential, Weighted, Hull, Variable, SIMPLE}; def openMA; def closeMA; def highMA; def lowMA; switch (movingAverageType) { case Simple: openMA = compoundValue(1, Average(open, period), open); closeMA = compoundValue(1, Average(close, period), close); highMA = compoundValue(1, Average(high, period), high); lowMA = compoundValue(1, Average(low, period), low); case Exponential: openMA = compoundValue(1, ExpAverage(open, period), open); closeMA = compoundValue(1, ExpAverage(close, period), close); highMA = compoundValue(1, ExpAverage(high, period), high); lowMA = compoundValue(1, ExpAverage(low, period), low); case Weighted: openMA = compoundValue(1, WMA(open, period), open); closeMA = compoundValue(1, WMA(close, period), close); highMA = compoundValue(1, WMA(high, period), high); lowMA = compoundValue(1, WMA(low, period), low); Case Hull: openMA = compoundValue(1, HullMovingAvg(open, period), open); closeMA = compoundValue(1, HullMovingAvg(close, period), close); highMA = compoundValue(1, HullMovingAvg(high, period), high); lowMA = compoundValue(1, HullMovingAvg(low, period), low); case variable: openMA = compoundValue(1, VariableMA(open, period), open); closeMA = compoundValue(1, VariableMA(close, period), close); highMA = compoundValue(1, VariableMA(high, period), high); lowMA = compoundValue(1, VariableMA(low, period), low); case TEMA: openMA = compoundValue(1, TEMA(open, period), open); closeMA = compoundValue(1, TEMA(close, period), close); highMA = compoundValue(1, TEMA(high, period), high); lowMA = compoundValue(1, TEMA(low, period), low); } hidePricePlot(hideCandles); def haOpen; def haClose; switch(candleSmoothing) { case Valcu: haOpen = CompoundValue(1, ( (haOpen[1] + (openMA[1] + highMA[1] + lowMA[1] + closeMA[1]) /4.0)/2.0), open); haClose = ((OpenMA + HighMA + LowMA + CloseMA)/4.0) ; case Vervoort: haOpen = CompoundValue(1, ( (haOpen[1] + (openMA[1] + highMA[1] + lowMA[1] + closeMA[1]) /4.0)/2.0), open); haClose = ((((OpenMA + HighMA + LowMA + CloseMA)/4.0) + haOpen + Max(HighMA, haOpen) + Min(LowMA, haOpen))/4.0); } plot o = haopen; o.hide(); def haLow = min(lowMA, haOpen); def haHigh = max(highMA,haOpen); AddChart(high = haHigh, low = haLow, open = o, close = haclose, type = ChartType.CANDLE, growColor = GlobalColor("RisingMA"), fallColor = GlobalColor("FallingMA"), neutralColor = color.gray);
Is there a way to modify this code so that the heikin ashi candles are only painted for the current trend and all previous heikin ashi candles are grayed out? So using this picture as an example, only the last 4 heikin ashi candles would be painted green and all previous heikin ashi candles would be grayed out.Hi, I'm new here.
I really wanted to try out a Smoothed Heiken-Ashi study for TOS, since it is not available in the default program I looked for a script online, which brought me here. I edited the study from page 1 by HoboTheClown/blt to get the green ha-candles working as I expected. I don't do much scripting but I thought others might find it useful.
Code:# Heikin Ashi Smoothed # HoboTheClown / blt # 9.15.2016 # HoboTheClown: I recently found a code for smoothed heiken ashi bars, # however for some reason all the bars are displayed as one color (going up or down). # # blt: Modified the code and replaced the addchart code at the bottom, # you should now see proper coloring. This is how that was coded to plot # as an overlay to the chart candlesticks. That is two sets of candles, # with different coloring for each. If you have the heikin ashi candle # coloring code on your chart, then they will likely appear the same color. #Update that "fixes" the green candles. #JTP #02/7/2021 input period = 20; input hideCandles = Yes; #Now functional - JTP input candleSmoothing = {default Valcu, Vervoort}; DefineGlobalColor("RisingMA", color.green); DefineGlobalColor("FallingMA", color.red); input movingAverageType = {Simple, default Exponential, Weighted, Hull, Variable, TEMA}; def openMA; def closeMA; def highMA; def lowMA; switch (movingAverageType) { case Simple: openMA = compoundValue(1, Average(open, period), open); closeMA = compoundValue(1, Average(close, period), close); highMA = compoundValue(1, Average(high, period), high); lowMA = compoundValue(1, Average(low, period), low); case Exponential: openMA = compoundValue(1, ExpAverage(open, period), open); closeMA = compoundValue(1, ExpAverage(close, period), close); highMA = compoundValue(1, ExpAverage(high, period), high); lowMA = compoundValue(1, ExpAverage(low, period), low); case Weighted: openMA = compoundValue(1, WMA(open, period), open); closeMA = compoundValue(1, WMA(close, period), close); highMA = compoundValue(1, WMA(high, period), high); lowMA = compoundValue(1, WMA(low, period), low); Case Hull: openMA = compoundValue(1, HullMovingAvg(open, period), open); closeMA = compoundValue(1, HullMovingAvg(close, period), close); highMA = compoundValue(1, HullMovingAvg(high, period), high); lowMA = compoundValue(1, HullMovingAvg(low, period), low); case variable: openMA = compoundValue(1, VariableMA(open, period), open); closeMA = compoundValue(1, VariableMA(close, period), close); highMA = compoundValue(1, VariableMA(high, period), high); lowMA = compoundValue(1, VariableMA(low, period), low); case TEMA: openMA = compoundValue(1, TEMA(open, period), open); closeMA = compoundValue(1, TEMA(close, period), close); highMA = compoundValue(1, TEMA(high, period), high); lowMA = compoundValue(1, TEMA(low, period), low); } hidePricePlot(hideCandles); def haOpen; def haClose; switch(candleSmoothing) { case Valcu: haOpen = CompoundValue(1, ( (haOpen[1] + (openMA[1] + highMA[1] + lowMA[1] + closeMA[1]) /4.0)/2.0), open); haClose = ((OpenMA + HighMA + LowMA + CloseMA)/4.0) ; case Vervoort: haOpen = CompoundValue(1, ( (haOpen[1] + (openMA[1] + highMA[1] + lowMA[1] + closeMA[1]) /4.0)/2.0), open); haClose = ((((OpenMA + HighMA + LowMA + CloseMA)/4.0) + haOpen + Max(HighMA, haOpen) + Min(LowMA, haOpen))/4.0); } plot o = haOpen + 0; o.hide(); ### Wicks and Shadows def haLow = min(lowMA, haOpen); def haHigh = max(highMA,haOpen); ### NO LONGER SUPPORTED BY TOS ### ### AddChart(high = haHigh, low = haLow, open = o, close = haclose, type = ChartType.CANDLE, growColor = GlobalColor("RisingMA"), fallColor = GlobalColor("FallingMA"), neutralColor = color.gray); #Red Candlesticks -----------------------------------------------------------------| input charttype = ChartType.CANDLE; def haOpen_fall = if haOpen>haClose then haOpen else double.nan; def haHigh_fall = if haOpen>=haClose then haHigh else double.nan; def haLow_fall = if haOpen>=haClose then haLow else double.nan; def haClose_fall = if haOpen>=haClose then haClose else double.nan; AddChart(growColor = Color.red, fallColor = Color.green, neutralColor = Color.current, high = haHigh_fall, low = haLow_fall, open = haOpen_fall, close = haClose_fall , type = ChartType.CANDLE); #Green Candlesticks -----------------------------------------------------------------| #Removed and/or replaced - JTP #def HAclose1 = if haOpen<=haClose # then hahigh # else double.nan; #def HAclose1 = ohlc4 -1; #def HAopen1 = if haopen<=haclose # then haclose # then CompoundValue(1, (HAopen[1] + HAclose[1]) /2, (open[1] + close[1]) / 2) # else double.nan; def haOpen_rise = if haOpen<haClose then haClose else double.nan; def haHigh_rise = if haOpen<=haClose then haHigh else double.nan; def haLow_rise = if haOpen<=haClose then haLow else double.nan; def haClose_rise = if haOpen<=haClose then haOpen else double.nan; AddChart(growColor = Color.green, fallColor = Color.red, neutralColor = Color.current, high = haHigh_rise, low = haLow_rise, open = haOpen_rise, close = HAclose_rise, type = ChartType.CANDLE); # End Study ##############################################################################

Thanks very much in advance for any assistance!
Is there a way to modify this code so that the heikin ashi candles are only painted for the current trend and all previous heikin ashi candles are grayed out? So using this picture as an example, only the last 4 heikin ashi candles would be painted green and all previous heikin ashi candles would be grayed out.
Thanks very much in advance for any assistance!
See how this works. Set input debug to test how it identifies through the barnumber() of the highestall(last) the beginning of the last color stream.
 Ruby:
Ruby:# Heikin Ashi Smoothed # HoboTheClown / blt # 9.15.2016 # HoboTheClown: I recently found a code for smoothed heiken ashi bars, # however for some reason all the bars are displayed as one color (going up or down). # # blt: Modified the code and replaced the addchart code at the bottom, # you should now see proper coloring. This is how that was coded to plot # as an overlay to the chart candlesticks. That is two sets of candles, # with different coloring for each. If you have the heikin ashi candle # coloring code on your chart, then they will likely appear the same color. #Update that "fixes" the green candles. #JTP #02/7/2021 input period = 20; input hideCandles = Yes; #Now functional - JTP input candleSmoothing = {default Valcu, Vervoort}; DefineGlobalColor("RisingMA", Color.GREEN); DefineGlobalColor("FallingMA", Color.RED); input movingAverageType = {Simple, default Exponential, Weighted, Hull, Variable, TEMA}; def openMA; def closeMA; def highMA; def lowMA; switch (movingAverageType) { case Simple: openMA = CompoundValue(1, Average(open, period), open); closeMA = CompoundValue(1, Average(close, period), close); highMA = CompoundValue(1, Average(high, period), high); lowMA = CompoundValue(1, Average(low, period), low); case Exponential: openMA = CompoundValue(1, ExpAverage(open, period), open); closeMA = CompoundValue(1, ExpAverage(close, period), close); highMA = CompoundValue(1, ExpAverage(high, period), high); lowMA = CompoundValue(1, ExpAverage(low, period), low); case Weighted: openMA = CompoundValue(1, WMA(open, period), open); closeMA = CompoundValue(1, WMA(close, period), close); highMA = CompoundValue(1, WMA(high, period), high); lowMA = CompoundValue(1, WMA(low, period), low); case Hull: openMA = CompoundValue(1, HullMovingAvg(open, period), open); closeMA = CompoundValue(1, HullMovingAvg(close, period), close); highMA = CompoundValue(1, HullMovingAvg(high, period), high); lowMA = CompoundValue(1, HullMovingAvg(low, period), low); case Variable: openMA = CompoundValue(1, VariableMA(open, period), open); closeMA = CompoundValue(1, VariableMA(close, period), close); highMA = CompoundValue(1, VariableMA(high, period), high); lowMA = CompoundValue(1, VariableMA(low, period), low); case TEMA: openMA = CompoundValue(1, TEMA(open, period), open); closeMA = CompoundValue(1, TEMA(close, period), close); highMA = CompoundValue(1, TEMA(high, period), high); lowMA = CompoundValue(1, TEMA(low, period), low); } HidePricePlot(hideCandles); def haOpen; def haClose; switch (candleSmoothing) { case Valcu: haOpen = CompoundValue(1, ( (haOpen[1] + (openMA[1] + highMA[1] + lowMA[1] + closeMA[1]) / 4.0) / 2.0), open); haClose = ((openMA + highMA + lowMA + closeMA) / 4.0) ; case Vervoort: haOpen = CompoundValue(1, ( (haOpen[1] + (openMA[1] + highMA[1] + lowMA[1] + closeMA[1]) / 4.0) / 2.0), open); haClose = ((((openMA + highMA + lowMA + closeMA) / 4.0) + haOpen + Max(highMA, haOpen) + Min(lowMA, haOpen)) / 4.0); } plot o = haOpen + 0; o.Hide(); ### Wicks and Shadows def haLow = Min(lowMA, haOpen); def haHigh = Max(highMA, haOpen); input debug = no; def last = if haOpen[1] < haClose[1] and haOpen > haClose then BarNumber() else if haOpen[1] > haClose[1] and haOpen < haClose then BarNumber() else Double.NaN; AddLabel(debug, HighestAll(last)); plot xlast = if !debug then Double.NaN else BarNumber(); xlast.SetPaintingStrategy(PaintingStrategy.VALUES_BELOW); ### NO LONGER SUPPORTED BY TOS ### ### AddChart(high = haHigh, low = haLow, open = o, close = haclose, type = ChartType.CANDLE, growColor = GlobalColor("RisingMA"), fallColor = GlobalColor("FallingMA"), neutralColor = color.gray); #Red Candlesticks -----------------------------------------------------------------| input charttype = ChartType.CANDLE; def haOpen_fall = if haOpen > haClose then haOpen else Double.NaN; def haHigh_fall = if haOpen >= haClose then haHigh else Double.NaN; def haLow_fall = if haOpen >= haClose then haLow else Double.NaN; def haClose_fall = if haOpen >= haClose then haClose else Double.NaN; AddChart(growColor = Color.RED, fallColor = Color.GREEN, neutralColor = Color.CURRENT, high = if BarNumber() >= HighestAll(last) then haHigh_fall else Double.NaN, low = haLow_fall, open = haOpen_fall, close = haClose_fall , type = ChartType.CANDLE); AddChart(growColor = Color.GRAY, fallColor = Color.GREEN, neutralColor = Color.CURRENT, high = if BarNumber() < HighestAll(last) then haHigh_fall else Double.NaN, low = haLow_fall, open = haOpen_fall, close = haClose_fall , type = ChartType.CANDLE); #Green Candlesticks -----------------------------------------------------------------| #Removed and/or replaced - JTP #def HAclose1 = if haOpen<=haClose # then hahigh # else double.nan; #def HAclose1 = ohlc4 -1; #def HAopen1 = if haopen<=haclose # then haclose # then CompoundValue(1, (HAopen[1] + HAclose[1]) /2, (open[1] + close[1]) / 2) # else double.nan; def haOpen_rise = if haOpen < haClose then haClose else Double.NaN; def haHigh_rise = if haOpen <= haClose then haHigh else Double.NaN; def haLow_rise = if haOpen <= haClose then haLow else Double.NaN; def haClose_rise = if haOpen <= haClose then haOpen else Double.NaN; AddChart(growColor = Color.GREEN, fallColor = Color.RED, neutralColor = Color.CURRENT, high = if BarNumber() >= HighestAll(last) then haHigh_rise else Double.NaN, low = haLow_rise, open = haOpen_rise, close = haClose_rise, type = ChartType.CANDLE); AddChart(growColor = Color.GRAY, fallColor = Color.RED, neutralColor = Color.CURRENT, high = if BarNumber() < HighestAll(last) then haHigh_rise else Double.NaN, low = haLow_rise, open = haOpen_rise, close = haClose_rise, type = ChartType.CANDLE); # End Study ##############################################################################
WARNING: switching "Candle" field to "Equivolume" crashes TOS repeatedly issuing "Continue" or "Restart" crash prompt which recurs upon TOS restarting. Luckily had a previous workspace saved, quickly was able to reset workspace between crash messages!@Ronathan Edwards It is done - look at Post #25 from@ Thomas (BLT Version https://tos.mx/Au5c4zK). Turn "nowicks" to no and "show smoothed candles only" to no.
BullParagon
New member
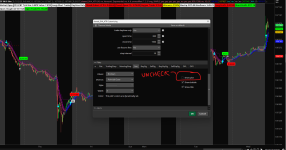
Does anyone know how to not show the smoothed HA candles in this study? I want to still show the line that is selectable in the input, but not show the HA candles themselves.
Does anyone know how to not show the smoothed HA candles in this study? I want to still show the line that is selectable in the input, but not show the HA candles themselves.
Sure, the input charttype is now usable. The image shows the regular candles with the smoothed HA as a line.
 Ruby:
Ruby:# Heikin Ashi Smoothed # HoboTheClown / blt # 9.15.2016 # HoboTheClown: I recently found a code for smoothed heiken ashi bars, # however for some reason all the bars are displayed as one color (going up or down). # # blt: Modified the code and replaced the addchart code at the bottom, # you should now see proper coloring. This is how that was coded to plot # as an overlay to the chart candlesticks. That is two sets of candles, # with different coloring for each. If you have the heikin ashi candle # coloring code on your chart, then they will likely appear the same color. #Update that "fixes" the green candles. #JTP #02/7/2021 input period = 20; input hideCandles = Yes; #Now functional - JTP input candleSmoothing = {default Valcu, Vervoort}; DefineGlobalColor("RisingMA", Color.GREEN); DefineGlobalColor("FallingMA", Color.RED); input movingAverageType = {Simple, default Exponential, Weighted, Hull, Variable, TEMA}; def openMA; def closeMA; def highMA; def lowMA; switch (movingAverageType) { case Simple: openMA = CompoundValue(1, Average(open, period), open); closeMA = CompoundValue(1, Average(close, period), close); highMA = CompoundValue(1, Average(high, period), high); lowMA = CompoundValue(1, Average(low, period), low); case Exponential: openMA = CompoundValue(1, ExpAverage(open, period), open); closeMA = CompoundValue(1, ExpAverage(close, period), close); highMA = CompoundValue(1, ExpAverage(high, period), high); lowMA = CompoundValue(1, ExpAverage(low, period), low); case Weighted: openMA = CompoundValue(1, WMA(open, period), open); closeMA = CompoundValue(1, WMA(close, period), close); highMA = CompoundValue(1, WMA(high, period), high); lowMA = CompoundValue(1, WMA(low, period), low); case Hull: openMA = CompoundValue(1, HullMovingAvg(open, period), open); closeMA = CompoundValue(1, HullMovingAvg(close, period), close); highMA = CompoundValue(1, HullMovingAvg(high, period), high); lowMA = CompoundValue(1, HullMovingAvg(low, period), low); case Variable: openMA = CompoundValue(1, VariableMA(open, period), open); closeMA = CompoundValue(1, VariableMA(close, period), close); highMA = CompoundValue(1, VariableMA(high, period), high); lowMA = CompoundValue(1, VariableMA(low, period), low); case TEMA: openMA = CompoundValue(1, TEMA(open, period), open); closeMA = CompoundValue(1, TEMA(close, period), close); highMA = CompoundValue(1, TEMA(high, period), high); lowMA = CompoundValue(1, TEMA(low, period), low); } HidePricePlot(hideCandles); def haOpen; def haClose; switch (candleSmoothing) { case Valcu: haOpen = CompoundValue(1, ( (haOpen[1] + (openMA[1] + highMA[1] + lowMA[1] + closeMA[1]) / 4.0) / 2.0), open); haClose = ((openMA + highMA + lowMA + closeMA) / 4.0) ; case Vervoort: haOpen = CompoundValue(1, ( (haOpen[1] + (openMA[1] + highMA[1] + lowMA[1] + closeMA[1]) / 4.0) / 2.0), open); haClose = ((((openMA + highMA + lowMA + closeMA) / 4.0) + haOpen + Max(highMA, haOpen) + Min(lowMA, haOpen)) / 4.0); } plot o = haOpen + 0; o.Hide(); ### Wicks and Shadows def haLow = Min(lowMA, haOpen); def haHigh = Max(highMA, haOpen); input debug = no; def last = if haOpen[1] < haClose[1] and haOpen > haClose then BarNumber() else if haOpen[1] > haClose[1] and haOpen < haClose then BarNumber() else Double.NaN; AddLabel(debug, HighestAll(last)); plot xlast = if !debug then Double.NaN else BarNumber(); xlast.SetPaintingStrategy(PaintingStrategy.VALUES_BELOW); ### NO LONGER SUPPORTED BY TOS ### ### AddChart(high = haHigh, low = haLow, open = o, close = haclose, type = ChartType.CANDLE, growColor = GlobalColor("RisingMA"), fallColor = GlobalColor("FallingMA"), neutralColor = color.gray); #Red Candlesticks -----------------------------------------------------------------| input charttype = ChartType.CANDLE; def haOpen_fall = if haOpen > haClose then haOpen else Double.NaN; def haHigh_fall = if haOpen >= haClose then haHigh else Double.NaN; def haLow_fall = if haOpen >= haClose then haLow else Double.NaN; def haClose_fall = if haOpen >= haClose then haClose else Double.NaN; AddChart(growColor = Color.RED, fallColor = Color.GREEN, neutralColor = Color.CURRENT, high = if BarNumber() >= HighestAll(last) then haHigh_fall else Double.NaN, low = haLow_fall, open = haOpen_fall, close = haClose_fall , type = ChartType); AddChart(growColor = Color.GRAY, fallColor = Color.GREEN, neutralColor = Color.CURRENT, high = if BarNumber() < HighestAll(last) then haHigh_fall else Double.NaN, low = haLow_fall, open = haOpen_fall, close = haClose_fall , type = ChartType); #Green Candlesticks -----------------------------------------------------------------| #Removed and/or replaced - JTP #def HAclose1 = if haOpen<=haClose # then hahigh # else double.nan; #def HAclose1 = ohlc4 -1; #def HAopen1 = if haopen<=haclose # then haclose # then CompoundValue(1, (HAopen[1] + HAclose[1]) /2, (open[1] + close[1]) / 2) # else double.nan; def haOpen_rise = if haOpen < haClose then haClose else Double.NaN; def haHigh_rise = if haOpen <= haClose then haHigh else Double.NaN; def haLow_rise = if haOpen <= haClose then haLow else Double.NaN; def haClose_rise = if haOpen <= haClose then haOpen else Double.NaN; AddChart(growColor = Color.GREEN, fallColor = Color.RED, neutralColor = Color.CURRENT, high = if BarNumber() >= HighestAll(last) then haHigh_rise else Double.NaN, low = haLow_rise, open = haOpen_rise, close = haClose_rise, type = ChartType); AddChart(growColor = Color.GRAY, fallColor = Color.RED, neutralColor = Color.CURRENT, high = if BarNumber() < HighestAll(last) then haHigh_rise else Double.NaN, low = haLow_rise, open = haOpen_rise, close = haClose_rise, type = ChartType); # End Study ##############################################################################
For those interested, here's my study with SHA (Blue and Plum background) and some other bells and whistles that have been added from various sources including myself. Personally, I use it on futures in either a larger tick range or in the 15-20 min timeframe. Obviously and smoothing isn't ideal for any quick timeframe.
http://tos.mx/YSdo0Do
This particular one is a 15 min 5-Year (/ZF) where I only trade my daytime hours (8:30am - 3pm).

http://tos.mx/YSdo0Do
This particular one is a 15 min 5-Year (/ZF) where I only trade my daytime hours (8:30am - 3pm).
@samer800 Would you kindly assist in adding the following moving average options to this indicator? Thank you very much in advance!Hi, I'm new here.
I really wanted to try out a Smoothed Heiken-Ashi study for TOS, since it is not available in the default program I looked for a script online, which brought me here. I edited the study from page 1 by HoboTheClown/blt to get the green ha-candles working as I expected. I don't do much scripting but I thought others might find it useful.
Code:# Heikin Ashi Smoothed # HoboTheClown / blt # 9.15.2016 # HoboTheClown: I recently found a code for smoothed heiken ashi bars, # however for some reason all the bars are displayed as one color (going up or down). # # blt: Modified the code and replaced the addchart code at the bottom, # you should now see proper coloring. This is how that was coded to plot # as an overlay to the chart candlesticks. That is two sets of candles, # with different coloring for each. If you have the heikin ashi candle # coloring code on your chart, then they will likely appear the same color. #Update that "fixes" the green candles. #JTP #02/7/2021 input period = 20; input hideCandles = Yes; #Now functional - JTP input candleSmoothing = {default Valcu, Vervoort}; DefineGlobalColor("RisingMA", color.green); DefineGlobalColor("FallingMA", color.red); input movingAverageType = {Simple, default Exponential, Weighted, Hull, Variable, TEMA}; def openMA; def closeMA; def highMA; def lowMA; switch (movingAverageType) { case Simple: openMA = compoundValue(1, Average(open, period), open); closeMA = compoundValue(1, Average(close, period), close); highMA = compoundValue(1, Average(high, period), high); lowMA = compoundValue(1, Average(low, period), low); case Exponential: openMA = compoundValue(1, ExpAverage(open, period), open); closeMA = compoundValue(1, ExpAverage(close, period), close); highMA = compoundValue(1, ExpAverage(high, period), high); lowMA = compoundValue(1, ExpAverage(low, period), low); case Weighted: openMA = compoundValue(1, WMA(open, period), open); closeMA = compoundValue(1, WMA(close, period), close); highMA = compoundValue(1, WMA(high, period), high); lowMA = compoundValue(1, WMA(low, period), low); Case Hull: openMA = compoundValue(1, HullMovingAvg(open, period), open); closeMA = compoundValue(1, HullMovingAvg(close, period), close); highMA = compoundValue(1, HullMovingAvg(high, period), high); lowMA = compoundValue(1, HullMovingAvg(low, period), low); case variable: openMA = compoundValue(1, VariableMA(open, period), open); closeMA = compoundValue(1, VariableMA(close, period), close); highMA = compoundValue(1, VariableMA(high, period), high); lowMA = compoundValue(1, VariableMA(low, period), low); case TEMA: openMA = compoundValue(1, TEMA(open, period), open); closeMA = compoundValue(1, TEMA(close, period), close); highMA = compoundValue(1, TEMA(high, period), high); lowMA = compoundValue(1, TEMA(low, period), low); } hidePricePlot(hideCandles); def haOpen; def haClose; switch(candleSmoothing) { case Valcu: haOpen = CompoundValue(1, ( (haOpen[1] + (openMA[1] + highMA[1] + lowMA[1] + closeMA[1]) /4.0)/2.0), open); haClose = ((OpenMA + HighMA + LowMA + CloseMA)/4.0) ; case Vervoort: haOpen = CompoundValue(1, ( (haOpen[1] + (openMA[1] + highMA[1] + lowMA[1] + closeMA[1]) /4.0)/2.0), open); haClose = ((((OpenMA + HighMA + LowMA + CloseMA)/4.0) + haOpen + Max(HighMA, haOpen) + Min(LowMA, haOpen))/4.0); } plot o = haOpen + 0; o.hide(); ### Wicks and Shadows def haLow = min(lowMA, haOpen); def haHigh = max(highMA,haOpen); ### NO LONGER SUPPORTED BY TOS ### ### AddChart(high = haHigh, low = haLow, open = o, close = haclose, type = ChartType.CANDLE, growColor = GlobalColor("RisingMA"), fallColor = GlobalColor("FallingMA"), neutralColor = color.gray); #Red Candlesticks -----------------------------------------------------------------| input charttype = ChartType.CANDLE; def haOpen_fall = if haOpen>haClose then haOpen else double.nan; def haHigh_fall = if haOpen>=haClose then haHigh else double.nan; def haLow_fall = if haOpen>=haClose then haLow else double.nan; def haClose_fall = if haOpen>=haClose then haClose else double.nan; AddChart(growColor = Color.red, fallColor = Color.green, neutralColor = Color.current, high = haHigh_fall, low = haLow_fall, open = haOpen_fall, close = haClose_fall , type = ChartType.CANDLE); #Green Candlesticks -----------------------------------------------------------------| #Removed and/or replaced - JTP #def HAclose1 = if haOpen<=haClose # then hahigh # else double.nan; #def HAclose1 = ohlc4 -1; #def HAopen1 = if haopen<=haclose # then haclose # then CompoundValue(1, (HAopen[1] + HAclose[1]) /2, (open[1] + close[1]) / 2) # else double.nan; def haOpen_rise = if haOpen<haClose then haClose else double.nan; def haHigh_rise = if haOpen<=haClose then haHigh else double.nan; def haLow_rise = if haOpen<=haClose then haLow else double.nan; def haClose_rise = if haOpen<=haClose then haOpen else double.nan; AddChart(growColor = Color.green, fallColor = Color.red, neutralColor = Color.current, high = haHigh_rise, low = haLow_rise, open = haOpen_rise, close = HAclose_rise, type = ChartType.CANDLE); # End Study ##############################################################################

McGinley
ALMA
LSMA
VWMA
Last edited:
Please let me know if this is possible. I was trying to see if we could leave hollow candles where there's a wick (consolidation) and have the candle as solid where the base is flat (trending). colors are already there as needed but this would give a good edge on when to enter -> only when the trend is now strong and over the consolidating bars.
@samer800 Would you able to assist in adding the following moving average options to this indicator?: SMMA, VWMA, RMS, DEMA, ZLSMA, ZLDEMA, ZLTEMA, McGinley, ALMA, LSMA, SWMA, Gaussian? I've tried copying the code for these MAs from the other indicators you created and adding to this one but it doesn't seem to work. I sincerely appreciate your help!Hi, I'm new here.
I really wanted to try out a Smoothed Heiken-Ashi study for TOS, since it is not available in the default program I looked for a script online, which brought me here. I edited the study from page 1 by HoboTheClown/blt to get the green ha-candles working as I expected. I don't do much scripting but I thought others might find it useful.
Code:# Heikin Ashi Smoothed # HoboTheClown / blt # 9.15.2016 # HoboTheClown: I recently found a code for smoothed heiken ashi bars, # however for some reason all the bars are displayed as one color (going up or down). # # blt: Modified the code and replaced the addchart code at the bottom, # you should now see proper coloring. This is how that was coded to plot # as an overlay to the chart candlesticks. That is two sets of candles, # with different coloring for each. If you have the heikin ashi candle # coloring code on your chart, then they will likely appear the same color. #Update that "fixes" the green candles. #JTP #02/7/2021 input period = 20; input hideCandles = Yes; #Now functional - JTP input candleSmoothing = {default Valcu, Vervoort}; DefineGlobalColor("RisingMA", color.green); DefineGlobalColor("FallingMA", color.red); input movingAverageType = {Simple, default Exponential, Weighted, Hull, Variable, TEMA}; def openMA; def closeMA; def highMA; def lowMA; switch (movingAverageType) { case Simple: openMA = compoundValue(1, Average(open, period), open); closeMA = compoundValue(1, Average(close, period), close); highMA = compoundValue(1, Average(high, period), high); lowMA = compoundValue(1, Average(low, period), low); case Exponential: openMA = compoundValue(1, ExpAverage(open, period), open); closeMA = compoundValue(1, ExpAverage(close, period), close); highMA = compoundValue(1, ExpAverage(high, period), high); lowMA = compoundValue(1, ExpAverage(low, period), low); case Weighted: openMA = compoundValue(1, WMA(open, period), open); closeMA = compoundValue(1, WMA(close, period), close); highMA = compoundValue(1, WMA(high, period), high); lowMA = compoundValue(1, WMA(low, period), low); Case Hull: openMA = compoundValue(1, HullMovingAvg(open, period), open); closeMA = compoundValue(1, HullMovingAvg(close, period), close); highMA = compoundValue(1, HullMovingAvg(high, period), high); lowMA = compoundValue(1, HullMovingAvg(low, period), low); case variable: openMA = compoundValue(1, VariableMA(open, period), open); closeMA = compoundValue(1, VariableMA(close, period), close); highMA = compoundValue(1, VariableMA(high, period), high); lowMA = compoundValue(1, VariableMA(low, period), low); case TEMA: openMA = compoundValue(1, TEMA(open, period), open); closeMA = compoundValue(1, TEMA(close, period), close); highMA = compoundValue(1, TEMA(high, period), high); lowMA = compoundValue(1, TEMA(low, period), low); } hidePricePlot(hideCandles); def haOpen; def haClose; switch(candleSmoothing) { case Valcu: haOpen = CompoundValue(1, ( (haOpen[1] + (openMA[1] + highMA[1] + lowMA[1] + closeMA[1]) /4.0)/2.0), open); haClose = ((OpenMA + HighMA + LowMA + CloseMA)/4.0) ; case Vervoort: haOpen = CompoundValue(1, ( (haOpen[1] + (openMA[1] + highMA[1] + lowMA[1] + closeMA[1]) /4.0)/2.0), open); haClose = ((((OpenMA + HighMA + LowMA + CloseMA)/4.0) + haOpen + Max(HighMA, haOpen) + Min(LowMA, haOpen))/4.0); } plot o = haOpen + 0; o.hide(); ### Wicks and Shadows def haLow = min(lowMA, haOpen); def haHigh = max(highMA,haOpen); ### NO LONGER SUPPORTED BY TOS ### ### AddChart(high = haHigh, low = haLow, open = o, close = haclose, type = ChartType.CANDLE, growColor = GlobalColor("RisingMA"), fallColor = GlobalColor("FallingMA"), neutralColor = color.gray); #Red Candlesticks -----------------------------------------------------------------| input charttype = ChartType.CANDLE; def haOpen_fall = if haOpen>haClose then haOpen else double.nan; def haHigh_fall = if haOpen>=haClose then haHigh else double.nan; def haLow_fall = if haOpen>=haClose then haLow else double.nan; def haClose_fall = if haOpen>=haClose then haClose else double.nan; AddChart(growColor = Color.red, fallColor = Color.green, neutralColor = Color.current, high = haHigh_fall, low = haLow_fall, open = haOpen_fall, close = haClose_fall , type = ChartType.CANDLE); #Green Candlesticks -----------------------------------------------------------------| #Removed and/or replaced - JTP #def HAclose1 = if haOpen<=haClose # then hahigh # else double.nan; #def HAclose1 = ohlc4 -1; #def HAopen1 = if haopen<=haclose # then haclose # then CompoundValue(1, (HAopen[1] + HAclose[1]) /2, (open[1] + close[1]) / 2) # else double.nan; def haOpen_rise = if haOpen<haClose then haClose else double.nan; def haHigh_rise = if haOpen<=haClose then haHigh else double.nan; def haLow_rise = if haOpen<=haClose then haLow else double.nan; def haClose_rise = if haOpen<=haClose then haOpen else double.nan; AddChart(growColor = Color.green, fallColor = Color.red, neutralColor = Color.current, high = haHigh_rise, low = haLow_rise, open = haOpen_rise, close = HAclose_rise, type = ChartType.CANDLE); # End Study ##############################################################################

when I pasted the above codes, my chart only shows Heikin Ashi, how would I add the price on it?@samer800 Would you able to assist in adding the following moving average options to this indicator?: SMMA, VWMA, RMS, DEMA, ZLSMA, ZLDEMA, ZLTEMA, McGinley, ALMA, LSMA, SWMA, Gaussian? I've tried copying the code for these MAs from the other indicators you created and adding to this one but it doesn't seem to work. I sincerely appreciate your help!
from indicator setting change "hideCandles " from yes to nowhen I pasted the above codes, my chart only shows Heikin Ashi, how would I add the price on it?
Thank you for sharing this, I really like this, I removed a lot of stuff to make my TOS less laggy, still cant figure out which part of script can I delete to get rid of the green and red dots on each candle, on a short time frame it really crowds up the chart.For those interested, here's my study with SHA (Blue and Plum background) and some other bells and whistles that have been added from various sources including myself. Personally, I use it on futures in either a larger tick range or in the 15-20 min timeframe. Obviously and smoothing isn't ideal for any quick timeframe.
http://tos.mx/YSdo0Do
This particular one is a 15 min 5-Year (/ZF) where I only trade my daytime hours (8:30am - 3pm).
View attachment 16256
Thank you for sharing this, I really like this, I removed a lot of stuff to make my TOS less laggy, still cant figure out which part of script can I delete to get rid of the green and red dots on each candle, on a short time frame it really crowds up the chart.
Attachments
Join useThinkScript to post your question to a community of 21,000+ developers and traders.
| Thread starter | Similar threads | Forum | Replies | Date |
|---|---|---|---|---|
| P | Heikin-Ashi Candles Lower Chart For ThinkorSwim (assorted versions) | Indicators | 27 | |
| V | Heikin Ashi For ThinkOrSwim | Indicators | 19 | |
| C | RSI-Heiken Ashi For ThinkOrSwim | Indicators | 24 | |
|
|
MA Colored Heiken Ashi Trend with PaintBars for ThinkorSwim | Indicators | 17 | |
|
|
Heiken-Ashi Moving Average (HAMA) for ThinkorSwim | Indicators | 45 |
Similar threads
-
Heikin-Ashi Candles Lower Chart For ThinkorSwim (assorted versions)
- Started by petergluis
- Replies: 27
-
-
-
 MA Colored Heiken Ashi Trend with PaintBars for ThinkorSwim
- Started by Welkin
- Replies: 17
-

Not the exact question you're looking for?
Start a new thread and receive assistance from our community.
87k+
Posts
575
Online
Similar threads
-
Heikin-Ashi Candles Lower Chart For ThinkorSwim (assorted versions)
- Started by petergluis
- Replies: 27
-
-
-
MA Colored Heiken Ashi Trend with PaintBars for ThinkorSwim
- Started by Welkin
- Replies: 17
-
Similar threads
-
Heikin-Ashi Candles Lower Chart For ThinkorSwim (assorted versions)
- Started by petergluis
- Replies: 27
-
-
-
MA Colored Heiken Ashi Trend with PaintBars for ThinkorSwim
- Started by Welkin
- Replies: 17
-
The Market Trading Game Changer
Join 2,500+ subscribers inside the useThinkScript VIP Membership Club
- Exclusive indicators
- Proven strategies & setups
- Private Discord community
- ‘Buy The Dip’ signal alerts
- Exclusive members-only content
- Add-ons and resources
- 1 full year of unlimited support
Frequently Asked Questions
What is useThinkScript?
useThinkScript is the #1 community of stock market investors using indicators and other tools to power their trading strategies. Traders of all skill levels use our forums to learn about scripting and indicators, help each other, and discover new ways to gain an edge in the markets.
How do I get started?
We get it. Our forum can be intimidating, if not overwhelming. With thousands of topics, tens of thousands of posts, our community has created an incredibly deep knowledge base for stock traders. No one can ever exhaust every resource provided on our site.
If you are new, or just looking for guidance, here are some helpful links to get you started.
- The most viewed thread:
https://usethinkscript.com/threads/repainting-trend-reversal-for-thinkorswim.183/ - Our most popular indicator:
https://usethinkscript.com/threads/buy-the-dip-indicator-for-thinkorswim.3553/ - Answers to frequently asked questions:
https://usethinkscript.com/threads/answers-to-commonly-asked-questions.6006/
What are the benefits of VIP Membership?
VIP members get exclusive access to these proven and tested premium indicators: Buy the Dip, Advanced Market Moves 2.0, Take Profit, and Volatility Trading Range. In addition, VIP members get access to over 50 VIP-only custom indicators, add-ons, and strategies, private VIP-only forums, private Discord channel to discuss trades and strategies in real-time, customer support, trade alerts, and much more. Learn all about VIP membership here.
How can I access the premium indicators?
To access the premium indicators, which are plug and play ready, sign up for VIP membership here.