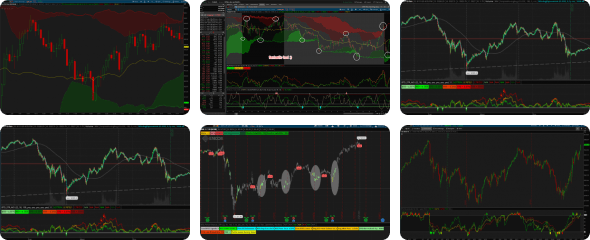
# Smart Money Volume Index [AlgoAlpha]
# Converted from Pine Script to thinkScript - W. Kalvin
Author states: This script measures buying and selling interest by comparing how price behaves on rising volume versus falling volume. It separates what is often called “smart money” activity from more passive volume and turns that relationship into a normalized index. The result is an oscillator that shows whether buyers or sellers are in control, how strong that control is, and when interest reaches extreme levels that tend to matter for reversals or continuations.

# CONCEPTS
# The calculation starts by splitting volume flow into two streams. Positive Volume Index (PVI) reacts when volume expands, while Negative Volume Index (NVI) reacts when volume contracts.
# Each stream is detrended with a long EMA and passed through an RSI calculation to express relative pressure. These two RSIs are then compared as ratios to estimate buy-side and sell-side interest. The values are summed over a rolling window and normalized against historical peaks so the output stays bounded and comparable across markets. In simple terms: relative behavior on high-volume vs low-volume bars defines interest, and normalization makes that interest readable over time.
# ♦ FEATURES
# 1. Two display modes: Compare (separate buy and sell interest) and Net (single combined oscillator)
The orginal Tradingview script:
https://www.tradingview.com/script/WBJhew74-Smart-Money-Volume-Index-AlgoAlpha/
Here is the ToS script:
# Converted from Pine Script to thinkScript - W. Kalvin
Author states: This script measures buying and selling interest by comparing how price behaves on rising volume versus falling volume. It separates what is often called “smart money” activity from more passive volume and turns that relationship into a normalized index. The result is an oscillator that shows whether buyers or sellers are in control, how strong that control is, and when interest reaches extreme levels that tend to matter for reversals or continuations.
# CONCEPTS
# The calculation starts by splitting volume flow into two streams. Positive Volume Index (PVI) reacts when volume expands, while Negative Volume Index (NVI) reacts when volume contracts.
# Each stream is detrended with a long EMA and passed through an RSI calculation to express relative pressure. These two RSIs are then compared as ratios to estimate buy-side and sell-side interest. The values are summed over a rolling window and normalized against historical peaks so the output stays bounded and comparable across markets. In simple terms: relative behavior on high-volume vs low-volume bars defines interest, and normalization makes that interest readable over time.
# ♦ FEATURES
# 1. Two display modes: Compare (separate buy and sell interest) and Net (single combined oscillator)
The orginal Tradingview script:
https://www.tradingview.com/script/WBJhew74-Smart-Money-Volume-Index-AlgoAlpha/
Here is the ToS script:
Code:
# Smart Money Volume Index [AlgoAlpha]
# Converted from Pine Script to thinkScript - W. Kalvin

declare lower;

# --- Inputs ---
input displayMode = {default "Net", "Compare"};
input indexPeriod = 25;
input volumeFlowPeriod = 14;
input normalizationPeriod = 500;
input highInterestThreshold = 0.9;

# --- Calculations ---
# PVI and NVI
def pvi = PositiveVolumeIndex();
def nvi = NegativeVolumeIndex();

def dumb = pvi - ExpAverage(pvi, 255);
def smart = nvi - ExpAverage(nvi, 255);

# RSI of PVI/NVI Oscillators
def drsi = RSI(price = dumb, length = volumeFlowPeriod);
def srsi = RSI(price = smart, length = volumeFlowPeriod);

# Ratios (handling potential division by zero)
def r_buy = if drsi != 0 then srsi / drsi else 0;
def r_sell = if (100 - drsi) != 0 then (100 - srsi) / (100 - drsi) else 0;

# Sums and Peak Normalization
def sums_buy = Sum(r_buy, indexPeriod);
def sums_sell = Sum(r_sell, indexPeriod);

def max_sums = Max(sums_buy, sums_sell);
def peak = Highest(max_sums, normalizationPeriod);

def index_buy = if peak != 0 then sums_buy / peak else 0;
def index_sell = if peak != 0 then sums_sell / peak else 0;
def net_index = index_buy - index_sell;

# --- Plot Definitions ---
plot ZeroLine = 0;
ZeroLine.SetDefaultColor(Color.GRAY);
ZeroLine.SetStyle(Curve.SHORT_DASH);

plot TopLimit = 1;
TopLimit.SetDefaultColor(Color.GRAY);
TopLimit.SetStyle(Curve.SHORT_DASH);

plot BottomLimit = -1;
BottomLimit.SetDefaultColor(Color.GRAY);
BottomLimit.SetStyle(Curve.SHORT_DASH);

plot HighBuyThreshold = highInterestThreshold;
HighBuyThreshold.SetDefaultColor(Color.DARK_GREEN);
HighBuyThreshold.SetStyle(Curve.SHORT_DASH);

plot HighSellThreshold = -highInterestThreshold;
HighSellThreshold.SetDefaultColor(Color.DARK_RED);
HighSellThreshold.SetStyle(Curve.SHORT_DASH);

# Compare Mode Plots
plot BuyInterest = if displayMode == displayMode."Compare" then index_buy else Double.NaN;
BuyInterest.SetDefaultColor(CreateColor(0, 255, 187));
BuyInterest.SetLineWeight(2);

plot SellInterest = if displayMode == displayMode."Compare" then -index_sell else Double.NaN;
SellInterest.SetDefaultColor(CreateColor(255, 17, 0));
SellInterest.SetLineWeight(2);

# Net Mode Histogram / Columns
plot NetHistogram = if displayMode == displayMode."Net" then net_index else Double.NaN;
NetHistogram.SetPaintingStrategy(PaintingStrategy.HISTOGRAM);
NetHistogram.SetLineWeight(3);
NetHistogram.AssignValueColor(if net_index > 0 then CreateColor(0, 255, 187) else CreateColor(255, 17, 0));

plot NetLine = if displayMode == displayMode."Net" then net_index else Double.NaN;
NetLine.SetDefaultColor(Color.WHITE);
NetLine.SetLineWeight(1);

# --- Threshold Clouds ---
def v_up = if displayMode == displayMode."Compare" then index_buy else net_index;
def v_dn = if displayMode == displayMode."Compare" then -index_sell else net_index;

def top_active = v_up > 0.7;
def bot_active = v_dn < -0.7;

AddCloud(HighBuyThreshold, TopLimit, Color.DARK_GREEN, Color.CURRENT);
AddCloud(BottomLimit, HighSellThreshold, Color.DARK_RED, Color.CURRENT);

# --- Alerts ---
def sig_buy = if displayMode == displayMode."Compare" then index_buy else net_index;
def sig_sell = if displayMode == displayMode."Compare" then index_sell else -net_index;

Alert(sig_buy crosses above highInterestThreshold, "High Smart Money Buy Interest", Alert.BAR, Sound.Chimes);
Alert(sig_sell crosses above highInterestThreshold, "High Smart Money Sell Interest", Alert.BAR, Sound.Ring);
Alert(sig_buy crosses below highInterestThreshold, "Smart Money Buy Interest no longer high", Alert.BAR, Sound.Bell);
Alert(sig_sell crosses below highInterestThreshold, "Smart Money Sell Interest no longer high", Alert.BAR, Sound.Bell);

Alert(sig_buy crosses above 0, "Smart Money Buy Interest turned positive", Alert.BAR, Sound.Chimes);
Alert(sig_buy crosses below 0, "Smart Money Buy Interest turned negative", Alert.BAR, Sound.Ding);
Alert(sig_sell crosses above 0, "Smart Money Sell Interest turned positive", Alert.BAR, Sound.Bell);
Alert(sig_sell crosses below 0, "Smart Money Sell Interest turned negative", Alert.BAR, Sound.Ding);
Last edited by a moderator: