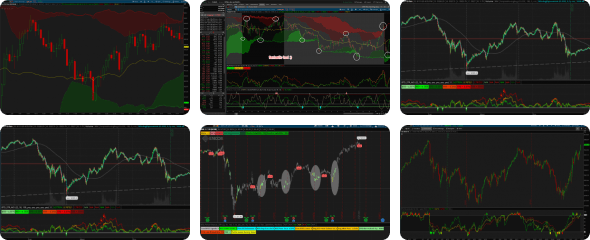

This post includes the lower and upper indicator along with a watchlist column.
Overview
The Relative Trend Index (RTI) developed by Zeiierman is an innovative technical analysis tool designed to measure the strength and direction of the market trend. Unlike some traditional indicators, the RTI boasts a distinctive ability to adapt and respond to market volatility, while still minimizing the effects of minor, short-term market fluctuations.
The Relative Trend Index blends trend-following and mean-reverting characteristics, paired with a customizable and intuitive approach to trend strength, and its sensitivity to price action makes this indicator stand out.
Original Concept: https://www.tradingview.com/script/VwmUNNwp-Relative-Trend-Index-RTI-by-Zeiierman/
This example is a 1 min chart of SPY.

Benefits of using this RTI instead of RSI
The Relative Strength Index (RSI) and the Relative Trend Index (RTI) are both powerful technical indicators, each with its own unique strengths.
However, there are key differences that make the RTI arguably more sophisticated and precise, especially when it comes to identifying trends and overbought/oversold (OB/OS) areas.
The RSI is a momentum oscillator that measures the speed and change of price movements and is typically used to identify overbought and oversold conditions in a market. However, its primary limitation lies in its tendency to produce false signals during extended trending periods.
Lower Indicator:
Upper Indicator:
Watchlist Column:
Overview
The Relative Trend Index (RTI) developed by Zeiierman is an innovative technical analysis tool designed to measure the strength and direction of the market trend. Unlike some traditional indicators, the RTI boasts a distinctive ability to adapt and respond to market volatility, while still minimizing the effects of minor, short-term market fluctuations.
The Relative Trend Index blends trend-following and mean-reverting characteristics, paired with a customizable and intuitive approach to trend strength, and its sensitivity to price action makes this indicator stand out.
Original Concept: https://www.tradingview.com/script/VwmUNNwp-Relative-Trend-Index-RTI-by-Zeiierman/
This example is a 1 min chart of SPY.
Benefits of using this RTI instead of RSI
The Relative Strength Index (RSI) and the Relative Trend Index (RTI) are both powerful technical indicators, each with its own unique strengths.
However, there are key differences that make the RTI arguably more sophisticated and precise, especially when it comes to identifying trends and overbought/oversold (OB/OS) areas.
The RSI is a momentum oscillator that measures the speed and change of price movements and is typically used to identify overbought and oversold conditions in a market. However, its primary limitation lies in its tendency to produce false signals during extended trending periods.
Lower Indicator:
Code:
# Relative Trend Index (RTI) - lower
# Original Concept: https://www.tradingview.com/script/VwmUNNwp-Relative-Trend-Index-RTI-by-Zeiierman/
# Converted and modified by Chewie 10/1/2026

declare lower;

input trendLength = 100;      # Pine: Trend Length (min 10, step 4 recommended)
input sensitivity = 95;       # Pine: Sensitivity (50-98)
input signalLength = 20;      # Pine: Signal Length (EMA of RTI)

def overboughtLevel = 80;
def oversoldLevel = 20;

# --- Upper/Lower trend series (close +/- 2-bar StDev) ---
def upperTrend = close + StandardDeviation(close, 2);
def lowerTrend = close - StandardDeviation(close, 2);
def pUpper = sensitivity / 100.0;
def qUp = pUpper - 0.5;
def rUp = qUp * qUp;
def zUpper = (((((-39.69683028665376 * rUp + 220.9460984245205) * rUp - 275.9285104469687) * rUp + 138.3577518672690) * rUp - 30.66479806614716) * rUp + 2.506628277459239) * qUp /
             (((((-54.47609879822406 * rUp + 161.5858368580409) * rUp - 155.6989798598866) * rUp + 66.80131188771972) * rUp - 13.28068155288572) * rUp + 1);

def pLower = (100 - sensitivity) / 100.0;
def qLo = pLower - 0.5;
def rLo = qLo * qLo;
def zLower = (((((-39.69683028665376 * rLo + 220.9460984245205) * rLo - 275.9285104469687) * rLo + 138.3577518672690) * rLo - 30.66479806614716) * rLo + 2.506628277459239) * qLo /
             (((((-54.47609879822406 * rLo + 161.5858368580409) * rLo - 155.6989798598866) * rLo + 66.80131188771972) * rLo - 13.28068155288572) * rLo + 1);

def upperMean = Average(upperTrend, trendLength);
def upperStDevW = StandardDeviation(upperTrend, trendLength);
def upperTrendVal = upperMean + zUpper * upperStDevW;

def lowerMean = Average(lowerTrend, trendLength);
def lowerStDevW = StandardDeviation(lowerTrend, trendLength);
def lowerTrendVal = lowerMean + zLower * lowerStDevW;

# --- Relative Trend Index and signal line ---
def RTI = (close - lowerTrendVal) / (upperTrendVal - lowerTrendVal) * 100;
def RTIMa = ExpAverage(RTI, signalLength);

plot RelativeTrendIndex = RTI;
#RelativeTrendIndex.SetDefaultColor(Color.CYAN);
RelativeTrendIndex.SetLineWeight(2);

plot MaRTI = RTIMa;
MaRTI.SetDefaultColor(Color.cyan);

# --- Color RTI line: RTI vs. its signal (RTIMa) and RTI vs. midline (50) ---
def aboveMa  = RTI > RTIMa;
def aboveMid = RTI > 50;

RelativeTrendIndex.AssignValueColor(
    if aboveMa and aboveMid then Color.GREEN
    else if !aboveMa and aboveMid then Createcolor(0,150,0)
    else if !aboveMa and !aboveMid then Color.RED
    else Color.DARK_ORANGE);

plot Mid = 50;
Mid.SetDefaultColor(Color.yellow);

plot Overbought = overboughtLevel;
Overbought.SetDefaultColor(Color.RED);

plot Oversold = oversoldLevel;
Oversold.SetDefaultColor(Color.GREEN);

plot Mtop = 66;
Mtop.SetDefaultColor(Color.gray);
plot Mbottom = 34;
Mbottom.SetDefaultColor(Color.gray);

plot top = 100;
top.SetDefaultColor(Createcolor(240,0,240));
plot bottom = 0;
bottom.SetDefaultColor(Createcolor(0,240,240));

plot Xtop = 120;
Xtop.SetDefaultColor(Color.white);
plot Xbottom = -20;
Xbottom.SetDefaultColor(Color.white);

AddCloud(top, Overbought, Color.DARK_red, Color.DARK_red);
AddCloud(bottom, Oversold, Color.DARK_green, Color.DARK_green);

def zoneAboveOB = if RTI > overboughtLevel then RTI else Double.NaN;
def zoneBelowOS = if RTI < oversoldLevel then RTI else Double.NaN;

AddCloud(zoneAboveOB, Overbought, Color.GREEN, Color.GREEN);
AddCloud(zoneBelowOS, Oversold, Color.RED, Color.RED);
AddCloud(top, Xtop, Createcolor(150,0,150), Createcolor(150,0,150));
AddCloud(Xbottom, bottom, Createcolor(0,150,150), Createcolor(0,150,150));
Upper Indicator:
Code:
# Relative Trend Index (RTI) - upper
# Original Concept: https://www.tradingview.com/script/VwmUNNwp-Relative-Trend-Index-RTI-by-Zeiierman/
# Converted and modified by Chewie 10/1/2026

declare upper;

input trendLength = 100;
input sensitivity = 95;
input signalLength = 20;
input overboughtLevel = 80;
input oversoldLevel = 20;
input extremeUpperLevel = 120;
input extremeLowerLevel = -20;
input MidUpperLevel = 66;
input MidLowerLevel = 34;
input colorBars = yes;        # color price bars by RTI vs. its signal line

# --- Upper/Lower trend series (close +/- 2-bar StDev) ---
def upperTrend = close + StandardDeviation(close, 2);
def lowerTrend = close - StandardDeviation(close, 2);

# --- Percentile approximation: mean + z*stdev (inverse normal CDF) ---
def pUpper = sensitivity / 100.0;
def qUp = pUpper - 0.5;
def rUp = qUp * qUp;
def zUpper = (((((-39.69683028665376 * rUp + 220.9460984245205) * rUp - 275.9285104469687) * rUp + 138.3577518672690) * rUp - 30.66479806614716) * rUp + 2.506628277459239) * qUp /
             (((((-54.47609879822406 * rUp + 161.5858368580409) * rUp - 155.6989798598866) * rUp + 66.80131188771972) * rUp - 13.28068155288572) * rUp + 1);

def pLower = (100 - sensitivity) / 100.0;
def qLo = pLower - 0.5;
def rLo = qLo * qLo;
def zLower = (((((-39.69683028665376 * rLo + 220.9460984245205) * rLo - 275.9285104469687) * rLo + 138.3577518672690) * rLo - 30.66479806614716) * rLo + 2.506628277459239) * qLo /
             (((((-54.47609879822406 * rLo + 161.5858368580409) * rLo - 155.6989798598866) * rLo + 66.80131188771972) * rLo - 13.28068155288572) * rLo + 1);

def upperMean = Average(upperTrend, trendLength);
def upperStDevW = StandardDeviation(upperTrend, trendLength);
def upperTrendVal = upperMean + zUpper * upperStDevW;

def lowerMean = Average(lowerTrend, trendLength);
def lowerStDevW = StandardDeviation(lowerTrend, trendLength);
def lowerTrendVal = lowerMean + zLower * lowerStDevW;

# --- RTI and signal ---
def RTI = (close - lowerTrendVal) / (upperTrendVal - lowerTrendVal) * 100;
def RTIMa = ExpAverage(RTI, signalLength);

# --- Convert RTI levels into price bands ---
def bandRange = upperTrendVal - lowerTrendVal;

plot MidUpperBand = lowerTrendVal + MidUpperLevel / 100.0 * bandRange;   # RTI 66
plot ExtremeUpperBand = lowerTrendVal + extremeUpperLevel / 100.0 * bandRange;   # RTI 120
plot TopBand = upperTrendVal;                                      # RTI 100
plot OverboughtBand = lowerTrendVal + overboughtLevel / 100.0 * bandRange;
plot MidBand = lowerTrendVal + 0.5 * bandRange;                    # RTI 50
plot OversoldBand = lowerTrendVal + oversoldLevel / 100.0 * bandRange;
plot BottomBand = lowerTrendVal;                                   # RTI 0
plot ExtremeLowerBand = lowerTrendVal + extremeLowerLevel / 100.0 * bandRange;   # RTI -20
plot MidLowerBand = lowerTrendVal + MidLowerLevel / 100.0 * bandRange;   # RTI 34

# --- MaRTI (EMA of RTI) mapped onto the price scale ---
plot MaRTI = lowerTrendVal + RTIMa / 100.0 * bandRange;
MaRTI.SetDefaultColor(Color.CYAN);
MaRTI.SetLineWeight(2);

MidUpperBand.SetDefaultColor(Color.gray);
MidLowerBand.SetDefaultColor(Color.gray);
ExtremeUpperBand.SetDefaultColor(Color.WHITE);
ExtremeLowerBand.SetDefaultColor(Color.WHITE);
TopBand.SetDefaultColor(Createcolor(240,0,240));
OverboughtBand.SetDefaultColor(Color.RED);
MidBand.SetDefaultColor(Color.YELLOW);
OversoldBand.SetDefaultColor(Color.GREEN);
BottomBand.SetDefaultColor(Createcolor(0,240,240));

ExtremeUpperBand.SetLineWeight(1);
ExtremeLowerBand.SetLineWeight(1);
TopBand.SetLineWeight(1);
BottomBand.SetLineWeight(1);
OverboughtBand.SetLineWeight(1);
OversoldBand.SetLineWeight(1);
MidBand.SetLineWeight(3);

# --- Zone fills between the outer and inner bands ---
AddCloud(TopBand, OverboughtBand, Color.DARK_RED, Color.DARK_RED);
AddCloud(OversoldBand, BottomBand, Color.DARK_GREEN, Color.DARK_GREEN);
AddCloud(TopBand, ExtremeUpperBand, Createcolor(150,0,150), Createcolor(150,0,150));
AddCloud(ExtremeLowerBand, BottomBand, Createcolor(0,150,150), Createcolor(0,150,150));

# --- Color price bars: RTI vs. its signal (RTIMa) and price vs. midband ---
def aboveMa  = RTI > RTIMa;
def aboveMid = close > MidBand;

AssignPriceColor(if !colorBars then Color.CURRENT
                 else if aboveMa and aboveMid then Color.GREEN
                 else if !aboveMa and aboveMid then Createcolor(0,150,0)
                 else if !aboveMa and !aboveMid then Color.RED
                 else Color.DARK_ORANGE);
Watchlist Column:
Code:
# Relative Trend Index (RTI) - Watchlist column
# Original Concept: https://www.tradingview.com/script/VwmUNNwp-Relative-Trend-Index-RTI-by-Zeiierman/
# Converted and modified by Chewie 10/1/2026

input trendLength = 100;
input sensitivity = 95;
input overboughtLevel = 80;
input oversoldLevel = 20;
input extremeUpperLevel = 120;
input extremeLowerLevel = -20;
input MidUpperLevel = 66;
input MidLowerLevel = 34;
input mode = {default Both, High, Low};   # which side this column checks

# --- Upper/Lower trend series (close +/- 2-bar StDev) ---
def upperTrend = close + StandardDeviation(close, 2);
def lowerTrend = close - StandardDeviation(close, 2);

# --- Percentile approximation: mean + z*stdev (inverse normal CDF) ---
def pUpper = sensitivity / 100.0;
def qUp = pUpper - 0.5;
def rUp = qUp * qUp;
def zUpper = (((((-39.69683028665376 * rUp + 220.9460984245205) * rUp - 275.9285104469687) * rUp + 138.3577518672690) * rUp - 30.66479806614716) * rUp + 2.506628277459239) * qUp /
             (((((-54.47609879822406 * rUp + 161.5858368580409) * rUp - 155.6989798598866) * rUp + 66.80131188771972) * rUp - 13.28068155288572) * rUp + 1);

def pLower = (100 - sensitivity) / 100.0;
def qLo = pLower - 0.5;
def rLo = qLo * qLo;
def zLower = (((((-39.69683028665376 * rLo + 220.9460984245205) * rLo - 275.9285104469687) * rLo + 138.3577518672690) * rLo - 30.66479806614716) * rLo + 2.506628277459239) * qLo /
             (((((-54.47609879822406 * rLo + 161.5858368580409) * rLo - 155.6989798598866) * rLo + 66.80131188771972) * rLo - 13.28068155288572) * rLo + 1);

def upperMean = Average(upperTrend, trendLength);
def upperStDevW = StandardDeviation(upperTrend, trendLength);
def upperTrendVal = upperMean + zUpper * upperStDevW;

def lowerMean = Average(lowerTrend, trendLength);
def lowerStDevW = StandardDeviation(lowerTrend, trendLength);
def lowerTrendVal = lowerMean + zLower * lowerStDevW;

def RTI = (close - lowerTrendVal) / (upperTrendVal - lowerTrendVal) * 100;
def bandRange = upperTrendVal - lowerTrendVal;

# --- Price bands (same as the upper study) ---
def extUpperBand = lowerTrendVal + extremeUpperLevel / 100.0 * bandRange;   # RTI 120
def topBand      = upperTrendVal;                                           # RTI 100
def obBand       = lowerTrendVal + overboughtLevel / 100.0 * bandRange;     # RTI 80
def midUpperBand = lowerTrendVal + MidUpperLevel / 100.0 * bandRange;       # RTI 66
def midLowerBand = lowerTrendVal + MidLowerLevel / 100.0 * bandRange;       # RTI 34
def osBand       = lowerTrendVal + oversoldLevel / 100.0 * bandRange;       # RTI 20
def bottomBand   = lowerTrendVal;                                           # RTI 0
def extLowerBand = lowerTrendVal + extremeLowerLevel / 100.0 * bandRange;   # RTI -20

def checkHigh = mode != mode.Low;
def checkLow  = mode != mode.High;

# --- High side, checked from the top down ---
def highExt = checkHigh and high > extUpperBand;                    # above 120
def highTop = checkHigh and high > topBand;                         # 100-120
def highOB  = checkHigh and high >= obBand;                         # 80-100
def highMid = checkHigh and high >= midUpperBand;                   # 66-80

# --- Low side, checked from the bottom up ---
def lowExt    = checkLow and low < extLowerBand;                    # below -20
def lowBottom = checkLow and low < bottomBand;                      # -20 to 0
def lowOS     = checkLow and low <= osBand;                         # 0-20
def lowMid    = checkLow and low <= midLowerBand;                   # 20-34

def inZone = highOB or lowOS;

plot Value = Round(RTI, 1);

Value.AssignValueColor(if inZone then Color.BLACK else Color.light_gray);

AssignBackgroundColor(
    if highExt or lowExt then Color.WHITE
    else if highTop then CreateColor(240, 0, 240)
    else if lowBottom then CreateColor(0, 240, 240)
    else if highOB then Color.RED
    else if lowOS then Color.GREEN
    else CreateColor(40, 40, 40));