mbarcala
Active member
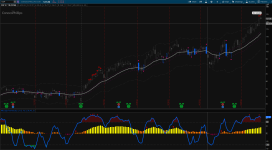
Here is a combination of QQE + Stochastic Indicator, its give you a nice and good possible entry and exit points with some custom levels of reversal.
Upper Indicator: https://usethinkscript.com/threads/break-keltner-bands-bkb-for-thinkorswim.11220/
Photo
14857[/ATTACH]']

script
Scanner
Watchlist Label
- QQE as Histogram
- Stochastic as Blue line
- Red and Green Arrows mean when QQE crosses up or down the qqe faster signal
- Gray level (30 = 80 and -30 = 20)
- Red Dots mean price goes over 45 = 95
Upper Indicator: https://usethinkscript.com/threads/break-keltner-bands-bkb-for-thinkorswim.11220/
Photo
14857[/ATTACH]']
script
Code:
# QQE and Stochastic Indicators by mbarcala at useThinkScript.com

declare lower;

input RSI_Period = 20;
input Slow_Factor = 5;
input qqeColLevel = 8.5;
input kPeriod = 14;
input dPeriod = 3;
input obosLevel = 30;
input stochLevel = 45;
input dotLevel = 3; # Position of the dots level up or down

def RSIndex = 4.236;
def Wilder_Period = RSI_Period * 2 - 1;
def rsi = RSI(price = close, length = RSI_Period);
def fullK = 100 * ((close - Lowest(low, kPeriod)) / (Highest(high, kPeriod) - Lowest(low, kPeriod)));

plot STOCHRSI = Round(ExpAverage(fullK, dPeriod) - 50, 2);
STOCHRSI.SetDefaultColor(CreateColor(0, 101, 255));
STOCHRSI.SetLineWeight(3);
#STOCHRSI.HideBubble();
STOCHRSI.HideTitle();

plot midline = 0;
midline.SetDefaultColor(Color.BLACK);
midline.SetLineWeight(1);
midline.HideTitle();

plot QQE = ExpAverage(rsi, Slow_Factor) - 50;
QQE.SetPaintingStrategy(PaintingStrategy.HISTOGRAM);
QQE.AssignValueColor(if QQE > midline and QQE < qqeColLevel then CreateColor(255, 120, 0) else
                     if QQE >= qqeColLevel then CreateColor(255, 250, 0) else
                     if QQE < midline and QQE > -qqeColLevel then CreateColor(118, 0, 60) else  #CreateColor(230, 17, 125)
                     if QQE <= -qqeColLevel then CreateColor(230, 17, 125) else Color.CURRENT);
QQE.SetLineWeight(5);
QQE.HideBubble();
QQE.HideTitle();

def atr_rsi = AbsValue(QQE[1] - QQE);
def atr_rsi_ma = ExpAverage(atr_rsi, Wilder_Period);
def DeltaFastAtrRsi = ExpAverage(atr_rsi_ma, Wilder_Period) * RSIndex;
def newshortband =  QQE + DeltaFastAtrRsi;
def newlongband = QQE - DeltaFastAtrRsi;
def longband = if QQE[1] > longband[1] and QQE > longband[1] then Max(longband[1], newlongband) else newlongband;
def shortband = if QQE[1] < shortband[1] and  QQE < shortband[1] then Min(shortband[1], newshortband) else newshortband;
def trend = if Crosses(QQE, shortband[1]) then 1 else if Crosses(longband[1], QQE) then -1 else if !IsNaN(trend[1]) then trend[1] else 1;
def pFastAtrRsiTL = if trend == 1 then longband else shortband;

def udDots = 4;
plot qqeBrk = if QQE crosses above pFastAtrRsiTL then QQE + udDots else
              if QQE crosses below pFastAtrRsiTL then QQE - udDots else Double.NaN;
qqeBrk.SetPaintingStrategy(PaintingStrategy.POINTS);
qqeBrk.SetDefaultColor(Color.BLACK);
qqeBrk.SetLineWeight(1);
qqeBrk.HideBubble();
qqeBrk.HideTitle();

plot qqeBrkBg = if QQE crosses above pFastAtrRsiTL then QQE + udDots else
                if QQE crosses below pFastAtrRsiTL then QQE - udDots else Double.NaN;
qqeBrkBg.SetPaintingStrategy(PaintingStrategy.POINTS);
qqeBrkBg.AssignValueColor(if QQE crosses above pFastAtrRsiTL then Color.GREEN else
                          if QQE crosses below pFastAtrRsiTL then Color.RED else Color.CURRENT);
qqeBrkBg.SetLineWeight(5);
qqeBrkBg.HideBubble();
qqeBrkBg.HideTitle();

plot obLevel = midline + obosLevel;
obLevel.SetStyle(Curve.MEDIUM_DASH);
obLevel.SetDefaultColor(Color.DARK_GRAY);
obLevel.SetLineWeight(1);
obLevel.HideTitle();

plot osLevel = midline - obosLevel;
osLevel.SetStyle(Curve.MEDIUM_DASH);
osLevel.SetDefaultColor(Color.DARK_GRAY);
osLevel.SetLineWeight(1);
osLevel.HideTitle();

plot stochUpDn = if STOCHRSI > stochLevel then STOCHRSI + dotLevel else if STOCHRSI < -stochLevel then STOCHRSI - dotLevel else Double.NaN;
stochUpDn.SetPaintingStrategy(PaintingStrategy.POINTS);
stochUpDn.AssignValueColor(if STOCHRSI > stochLevel then Color.RED else if STOCHRSI < -stochLevel then Color.GREEN else Color.CURRENT);
stochUpDn.SetLineWeight(2);
stochUpDn.HideBubble();
stochUpDn.HideTitle();

AddCloud(STOCHRSI, midline + obosLevel, CreateColor(255, 0, 0), CreateColor(17, 17, 17));
AddCloud(midline - obosLevel, STOCHRSI, CreateColor(0, 255, 0), CreateColor(17, 17, 17));
Scanner
Code:
#QQsToched Scanner

def kPeriod = 14;
def dPeriod = 3;
def fullK = 100 * ((close - Lowest(low, kPeriod)) / (Highest(high, kPeriod) - Lowest(low, kPeriod)));

plot STOCHRSI = ExpAverage(fullK, dPeriod) - 50;
plot obLevel = 35;
plot osLevel = -35;
Watchlist Label
Code:
#QQsToched Label

def kPeriod = 14;
def dPeriod = 3;
def fullK = 100 * ((close - Lowest(low, kPeriod)) / (Highest(high, kPeriod) - Lowest(low, kPeriod)));

def STOCHRSI = ExpAverage(fullK, dPeriod) - 50;
def obLevel = 35;
def osLevel = -35;

def cond1 = STOCHRSI > obLevel;
def cond2 = STOCHRSI < osLevel;

AddLabel(yes, if cond1 then "ob" else
              if cond2 then "os" else " ", Color.CURRENT);

AssignBackgroundColor(if cond1 then Color.DARK_RED else
                      if cond2 then Color.DARK_GREEN else CreateColor(10,10,10));
Attachments

Last edited: