Previous Day High/Low/Close + Premarket High/Low + High/Low/Open of Day + ATR Lines for ThinkorSwim

Wiinii

Member
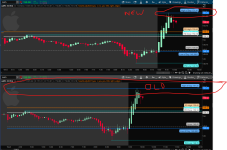
I looked around for a script with all the things and didn't see one, so I made one. You can change the colors and transparency of the bubbles under Globals as seen in 2nd pic, adjust the bubbles position to a specific time, and there is an option to turn off the bubbles altogether. By default the previous day's stuff is dashes, today's stuff is solid (but you can of course customize it all). You can also turn on the option to see previous days' stuff too. Enjoy!

UPDATES (1.6 - 4/7/23):
  • Now includes ATR projected move lines! Option for from open or previous day close.
  • You can now choose to have the bubbles show at a time or in the expansion area! To see it in the expansion area, click on the gear above the chart > go to Time Axis and change the Expansion area to a number that keeps them off your charts (this will vary depending on timeframe and zoom level).
Shared Link: http://tos.mx/LkI7ww4 (or use code below). Click here for --> Easiest way to load shared links

0D0Xy81.png


xTr4VSH.png


Code:
# Previous Day High/Low/Close + Premarket High/Low + High/Low/Open of Day + ATR Lines
# Created by Wiinii
# V1.6
# Some code based on code by Mobius (premarket) and TraderKevin (ATR lines
# https://usethinkscript.com/threads/previous-day-high-low-close-premarket-high-low-high-low-open-of-day-for-thinkorswim.13139/

declare hide_on_daily;

input length = 1;
input showOnlyLastPeriod = yes;
input ShowBubbles = yes;
input locate_bubbles_at = {default Expansion, Time};
input locate_bubbles_at_time = 800;
input BarsFromExpansion = 1;
input ShowPricesInBubbles = yes;

def bn = BarNumber();
def na = Double.NaN;
def h  = high;
def l  = low;
def o = open;
def c = close;
def v = volume;
def aggregationPeriod = AggregationPeriod.DAY;
def displace = -1;
def timeopen = SecondsFromTime(locate_bubbles_at_time) == 0;
def isExpansion = locate_bubbles_at == locate_bubbles_at.Expansion and IsNaN(close);
def firstExpansionBar = if !IsNaN(close[-1]) and isExpansion then 1 else if isExpansion then firstExpansionBar[1] + 1 else 0;
def BubbleLocation = if locate_bubbles_at == locate_bubbles_at.Time then timeopen else isExpansion and firstExpansionBar == BarsFromExpansion;

#----- Previous Day High/Low/Close -----#


plot PD_High;
plot PD_Low;
plot PD_Close;
if showOnlyLastPeriod and !IsNaN(close(period = aggregationPeriod)[-1]) {
    PD_High = na;
    PD_Low = na;
    PD_Close = na;
} else {
    PD_High = Highest(high(period = aggregationPeriod)[-displace], length);
    PD_Low = Lowest(low(period = aggregationPeriod)[-displace], length);
    PD_Close = close(period = aggregationPeriod)[-displace];
}

PD_High.SetDefaultColor(Color.DARK_ORANGE);
PD_High.SetStyle(Curve.LONG_DASH);
PD_High.SetLineWeight(2);
PD_High.HideTitle();

PD_Low.SetDefaultColor(Color.DARK_ORANGE);
PD_Low.SetStyle(Curve.LONG_DASH);
PD_Low.SetLineWeight(2);
PD_Low.HideTitle();

PD_Close.SetDefaultColor(Color.WHITE);
PD_Close.SetStyle(Curve.LONG_DASH);
PD_Close.SetLineWeight(2);
PD_Close.HideTitle();

DefineGlobalColor("PD_High", CreateColor(255, 204, 153));
AddChartBubble(ShowBubbles and BubbleLocation, PD_High, "PDH: " + (if ShowPricesInBubbles then AsText(PD_High) else ""), GlobalColor("PD_High"));

DefineGlobalColor("PD_Low", CreateColor(255, 204, 153));
AddChartBubble(ShowBubbles and BubbleLocation, PD_Low, "PDL: " + (if ShowPricesInBubbles then AsText(PD_Low) else ""), GlobalColor("PD_Low"), no);

DefineGlobalColor("PD_Close", Color.WHITE);
AddChartBubble(ShowBubbles and BubbleLocation, PD_Close, "PDC: " + (if ShowPricesInBubbles then AsText(PD_Close) else ""), GlobalColor("PD_Close"));

PD_High.HideBubble();
PD_Low.HideBubble();
PD_Close.HideBubble();


#----- Premarket High/Low -----# Thanks to Mobius

def GlobeX = GetTime() < RegularTradingStart(GetYYYYMMDD());

def vol = if GlobeX and !GlobeX[1]
then v
else if GlobeX
then vol[1] + v
else na;

def GlobeX_Volume = vol;

def ONhigh = if GlobeX and !GlobeX[1]
then h
else if GlobeX and
h > ONhigh[1]
then h
else ONhigh[1];

def ONhighBar = if GlobeX and h == ONhigh
then bn
else na;

def ONlow = if GlobeX and !GlobeX[1]
then l
else if GlobeX and
l < ONlow[1]
then l
else ONlow[1];

def ONlowBar = if GlobeX and l == ONlow
then bn
else na;

def OverNightHigh = if BarNumber() == HighestAll(ONhighBar)
then ONhigh
else OverNightHigh[1];

def OverNightLow = if BarNumber() == HighestAll(ONlowBar)
then ONlow
else OverNightLow[1];

plot PM_High;
plot PM_Low;
if showOnlyLastPeriod and !IsNaN(close(period = aggregationPeriod)[-1]) {
    PM_High = na;
    PM_Low = na;
} else {
    PM_High = if OverNightHigh > 0 then OverNightHigh else na;
    PM_Low = if OverNightLow > 0 then OverNightLow else na;
}

#PM_High.SetHiding(!PlotOverNightExtremes);
PM_High.SetLineWeight(2);
PM_High.SetDefaultColor(Color.CYAN);
PM_High.SetStyle(Curve.LONG_DASH);
PM_High.HideBubble();
PM_High.HideTitle();

#PM_Low.SetHiding(!PlotOverNightExtremes);
PM_Low.SetStyle(Curve.LONG_DASH);
PM_Low.SetDefaultColor(Color.CYAN);
PM_Low.HideBubble();
PM_Low.HideTitle();

DefineGlobalColor("PM_High", CreateColor(102, 255, 255));
AddChartBubble(ShowBubbles and if locate_bubbles_at == locate_bubbles_at.Time then bn == ONhighBar else isExpansion and firstExpansionBar == BarsFromExpansion, PM_High, "PMH: " + (if ShowPricesInBubbles then AsText(PM_High) else ""), GlobalColor("PM_High"));

DefineGlobalColor("PM_Low", CreateColor(102, 255, 255));
AddChartBubble(ShowBubbles and if locate_bubbles_at == locate_bubbles_at.Time then bn == ONlowBar else isExpansion and firstExpansionBar == BarsFromExpansion, PM_Low, "PML: " + (if ShowPricesInBubbles then AsText(PM_Low) else ""), GlobalColor("PM_Low"), no);


#----- Today Open/High/Low -----#


plot High_of_Day;
plot Low_of_Day;
plot DayOpen;
if showOnlyLastPeriod and !IsNaN(close(period = aggregationPeriod)[-1]) {
    DayOpen = na;
    High_of_Day = na;
    Low_of_Day = na;
} else {
    DayOpen = open(period = aggregationPeriod)[0];
    High_of_Day = Highest(high(period = aggregationPeriod), length);
    Low_of_Day = Lowest(low(period = aggregationPeriod), length);
}

DayOpen.SetDefaultColor (Color.GRAY);
DayOpen.SetPaintingStrategy(PaintingStrategy.DASHES);
DayOpen.SetLineWeight(2);
DayOpen.HideTitle();

High_of_Day.SetDefaultColor(CreateColor(0, 128, 255));
High_of_Day.SetPaintingStrategy(PaintingStrategy.HORIZONTAL);
High_of_Day.SetLineWeight(2);
High_of_Day.HideTitle();

Low_of_Day.SetDefaultColor(CreateColor(0, 128, 255));
Low_of_Day.SetPaintingStrategy(PaintingStrategy.HORIZONTAL);
Low_of_Day.SetLineWeight(2);
Low_of_Day.HideTitle();

DefineGlobalColor("Open", Color.LIGHT_GRAY);
AddChartBubble(ShowBubbles and BubbleLocation, DayOpen, "Open: " + (if ShowPricesInBubbles then AsText(DayOpen) else ""), GlobalColor("Open"));

DefineGlobalColor("High_of_Day", CreateColor(102, 178, 255));
AddChartBubble(ShowBubbles and BubbleLocation, High_of_Day, "HOD: " + (if ShowPricesInBubbles then AsText(High_of_Day) else ""), GlobalColor("High_of_Day"));

DefineGlobalColor("Low_of_Day", CreateColor(102, 178, 255));
AddChartBubble(ShowBubbles and BubbleLocation, Low_of_Day, "LOD: " + (if ShowPricesInBubbles then AsText(Low_of_Day) else ""), GlobalColor("Low_of_Day"), no);

#----- ATR Lines -----# Thaanks to TraderKevin
input showAtrLines = Yes;
input atrLinesFrom = {default pdc, dayOpen};
input ATRlength = 14;
input averageType = AverageType.WILDERS;

def ATR = MovingAverage(averageType, TrueRange(high(period = ”DAY”)[1], close(period = ”DAY”)[1], low(period = ”DAY”)[1]), ATRlength);

plot hatr = if atrLinesFrom  == atrLinesFrom .dayOpen then DayOpen + ATR else PD_Close + ATR;
plot latr = if atrLinesFrom  == atrLinesFrom .dayOpen then DayOpen - ATR else PD_Close - ATR;

hatr.SetLineWeight(5);
hatr.SetDefaultColor(Color.RED);
hatr.SetStyle(Curve.LONG_DASH);
hatr.HideBubble();
hatr.HideTitle();
hatr.SetHiding(showAtrLines == no);

latr.SetLineWeight(5);
latr.SetStyle(Curve.LONG_DASH);
latr.SetDefaultColor(Color.GREEN);
latr.HideBubble();
latr.HideTitle();
latr.SetHiding(showAtrLines == no);

DefineGlobalColor("hatr", Color.PINK);
AddChartBubble(ShowBubbles and showAtrLines and BubbleLocation, hatr, "ATRH: " + (if ShowPricesInBubbles then AsText(hatr) else ""), GlobalColor("hatr"));

DefineGlobalColor("latr", Color.LIGHT_GREEN);
AddChartBubble(ShowBubbles and showAtrLines and BubbleLocation, latr, "ATRL: " + (if ShowPricesInBubbles then AsText(latr) else ""), GlobalColor("latr"), no);
 
Last edited:
Well, I was trying to get the bubbles aligned to the right for a clean look. So I added the bubble mover as that was the only way I knew how. And also tried to get all the lines aligned across the chart and looking the same. Changing the script disabled the Global Colors, but no biggie.

The plots, didnt matter if I unchecked bubbles and plot, they were still on the chart. Only way is to uncheck all under the "inputs" section but not individually.

Thank you for the script, its snappier than what I was using.
 
Last edited:
Yeah, I would not have figured this out. I am still puzzled.

Is there a way to do the same with the original code here:
https://usethinkscript.com/threads/...w-high-low-open-of-day-for-thinkorswim.13139/

Sure, see input extend_plots = yes;

Screenshot-2022-11-05-131304.png
Ruby:
# Previous Day High/Low/Close + Premarket High/Low + High/Low/Open of Day
# Some code based on code by Mobius
# Created by Wiinii

declare hide_on_daily;

input extend_plots = yes;
input length = 1;
input showOnlyLastPeriod = yes;
input ShowBubbles = yes;
input locate_bubbles_at_time = 0930;

def bn = BarNumber();
def na = Double.NaN;
def h  = high;
def l  = low;
def o = open;
def c = close;
def v = volume;
def aggregationPeriod = AggregationPeriod.DAY;
def displace = -1;
def timeopen = SecondsFromTime(locate_bubbles_at_time) == 0;

#----- Previous Day High/Low/Close -----#

plot PD_High;
plot PD_Low;
plot PD_Close;
def PD_H = if extend_plots and isnan(close)
           then PD_H[1]
           else Highest(high(period = aggregationPeriod)[-displace], length);
def PD_L = if extend_plots and isnan(close)
           then PD_L[1]
           else Lowest(low(period = aggregationPeriod)[-displace], length);
def PD_C = if extend_plots and isnan(close)
           then PD_C[1]
           else close(period = aggregationPeriod)[-displace];
if showOnlyLastPeriod and !IsNaN(close(period = aggregationPeriod)[-1]) {
    PD_High = na;
    PD_Low = na;
    PD_Close = na;
} else {
    PD_High  = PD_H;
    PD_Low   = PD_L;
    PD_Close = PD_C;
}

PD_High.SetDefaultColor(color.DARK_ORANGE);
PD_High.SetpaintingStrategy(paintingStrategy.HORIZONTAL);
PD_High.SetLineWeight(2);
PD_High.HideTitle();

PD_Low.SetDefaultColor(color.DARK_ORANGE);
PD_Low.SetpaintingStrategy(paintingStrategy.HORIZONTAL);
PD_Low.SetLineWeight(2);
PD_Low.HideTitle();

PD_Close.SetDefaultColor(color.WHITE);
PD_Close.SetPaintingStrategy(paintingStrategy.HORIZONTAL);
PD_Close.SetLineWeight(2);
PD_Close.HideTitle();

DefineGlobalColor("PD_High", CreateColor(255,204,153));
AddChartBubble(ShowBubbles and timeopen, PD_High, "PD High: " + PD_High, GlobalColor("PD_High"));

DefineGlobalColor("PD_Low", CreateColor(255,204,153));
AddChartBubble(ShowBubbles and timeopen, PD_Low, "PD Low: " + PD_Low, GlobalColor("PD_Low"), no);

DefineGlobalColor("PD_Close", color.WHITE);
AddChartBubble(ShowBubbles and timeopen, PD_Close, "PD Close: " + PD_Close, GlobalColor("PD_Close"));


#----- Premarket High/Low -----#

def GlobeX = GetTime() < RegularTradingStart(GetYYYYMMDD());

def vol = if GlobeX and !GlobeX[1]
then v
else if GlobeX
then vol[1] + v
else na;

def GlobeX_Volume = vol;

def ONhigh = if GlobeX and !GlobeX[1]
then h
else if GlobeX and
h > ONhigh[1]
then h
else ONhigh[1];

def ONhighBar = if GlobeX and h == ONhigh
then bn
else na;

def ONlow = if GlobeX and !GlobeX[1]
then l
else if GlobeX and
l < ONlow[1]
then l
else ONlow[1];

def ONlowBar = if GlobeX and l == ONlow
then bn
else na;

def OverNightHigh = if BarNumber() == HighestAll(ONhighBar)
then ONhigh
else OverNightHigh[1];

def OverNightLow = if BarNumber() == HighestAll(ONlowBar)
then ONlow
else OverNightLow[1];

plot PM_High;
plot PM_Low;
def  PM_H = if extend_plots and isnan(close)
            then PM_H[1]
            else if OverNightHigh > 0 then OverNightHigh else na;
def  PM_L = if extend_plots and isnan(close)
            then PM_L[1]
            else if OverNightLow > 0 then OverNightLow else na;
if showOnlyLastPeriod and !IsNaN(close(period = aggregationPeriod)[-1]) {
    PM_High = na;
    PM_Low = na;
} else {
    PM_High = PM_H;
    PM_Low  = PM_L;
}

#PM_High.SetHiding(!PlotOverNightExtremes);
PM_High.SetLineWeight(2);
PM_High.SetDefaultColor(color.CYAN);
PM_High.SetPaintingStrategy(PaintingStrategy.HORIZONTAL);
PM_High.HideBubble();
PM_High.HideTitle();

#PM_Low.SetHiding(!PlotOverNightExtremes);
PM_Low.SetPaintingStrategy(PaintingStrategy.HORIZONTAL);
PM_Low.SetDefaultColor(Color.CYAN);
PM_Low.HideBubble();
PM_Low.HideTitle();

DefineGlobalColor("PM_High", CreateColor(102,255,255));
AddChartBubble(ShowBubbles and bn == ONhighBar, PM_High, "PM High: " + PM_High, GlobalColor("PM_High"));

DefineGlobalColor("PM_Low", CreateColor(102,255,255));
AddChartBubble(ShowBubbles and bn == ONlowBar, PM_Low, "PM Low: " + PM_Low, GlobalColor("PM_Low"), no); 


#----- Today Open/High/Low -----#

plot High_of_Day;
plot Low_of_Day;
Plot DayOpen;
def DOpen    = if extend_plots and isnan(close)
               then DOpen[1]
               else open(period = aggregationPeriod)[0];
def H_of_Day = if extend_plots and isnan(close)
               then H_of_Day[1]
               else Highest(high(period = aggregationPeriod), length);
def L_of_Day = if extend_plots and isnan(close)
               then L_of_Day[1]
               else Lowest(low(period = aggregationPeriod), length);
if showOnlyLastPeriod and !IsNaN(close(period = aggregationPeriod)[-1]) {
    DayOpen = na;
    High_of_Day = na;
    Low_of_Day = na;
} else {
    DayOpen     = DOpen;
    High_of_Day = H_of_Day;
    Low_of_Day  = L_of_Day;
}

DayOpen.SetDefaultColor (Color.GRAY);
DayOpen.SetPaintingStrategy(PaintingStrategy.DASHES);
DayOpen.SetLineWeight(2);
DayOpen.HideTitle();

High_of_Day.SetDefaultColor(CreateColor(0,128,255));
High_of_Day.SetPaintingStrategy(PaintingStrategy.HORIZONTAL);
High_of_Day.SetLineWeight(2);
High_of_Day.HideTitle();

Low_of_Day.SetDefaultColor(CreateColor(0,128,255));
Low_of_Day.SetPaintingStrategy(PaintingStrategy.HORIZONTAL);
Low_of_Day.SetLineWeight(2);
Low_of_Day.HideTitle();

DefineGlobalColor("Open", color.LIGHT_GRAY);
AddChartBubble(ShowBubbles and timeopen, DayOpen, "Open: " + DayOpen, GlobalColor("Open"));

DefineGlobalColor("High_of_Day", CreateColor(102,178,255));
AddChartBubble(ShowBubbles and timeopen, High_of_Day, "High of Day: " + High_of_Day, GlobalColor("High_of_Day"));

DefineGlobalColor("Low_of_Day", CreateColor(102,178,255));
AddChartBubble(ShowBubbles and timeopen, Low_of_Day, "Low of Day: " + Low_of_Day, GlobalColor("Low_of_Day"), no);
 
Please see the image below...PD CLose, Open bubbles are covering the candles. How do I display them towards right end instead of displaying them on top of candles.


http://tos.mx/CRrzKlK

Your request was very confusing as you started asking about poc/vah/val, which is what this thread is about, and switched to PD Close, Open bubbles, which pesol84907 was the originator of that code, not you.

Anyway, I found it and have made the adjustment to show the bubbles at the right_edge. You can choose to keep them at timeopen or right_edge at the input bubble_placement.

Screenshot-2022-11-12-204945.png
Ruby:
# Previous Day High/Low/Close + Premarket High/Low + High/Low/Open of Day
# Some code based on code by Mobius
# Created by Wiinii

declare hide_on_daily;

input extend_plots = yes;
input length = 1;
input showOnlyLastPeriod = yes;
input ShowBubbles = yes;
input locate_bubbles_at_time = 0930;


def bn = BarNumber();
def na = Double.NaN;
def h  = high;
def l  = low;
def o = open;
def c = close;
def v = volume;
def aggregationPeriod = AggregationPeriod.DAY;
def displace = -1;
def timeopen = SecondsFromTime(locate_bubbles_at_time) == 0;

#----- Previous Day High/Low/Close -----#

plot PD_High;
plot PD_Low;
plot PD_Close;
def PD_H = if extend_plots and isnan(close)
           then PD_H[1]
           else Highest(high(period = aggregationPeriod)[-displace], length);
def PD_L = if extend_plots and isnan(close)
           then PD_L[1]
           else Lowest(low(period = aggregationPeriod)[-displace], length);
def PD_C = if extend_plots and isnan(close)
           then PD_C[1]
           else close(period = aggregationPeriod)[-displace];
if showOnlyLastPeriod and !IsNaN(close(period = aggregationPeriod)[-1]) {
    PD_High = na;
    PD_Low = na;
    PD_Close = na;
} else {
    PD_High  = PD_H;
    PD_Low   = PD_L;
    PD_Close = PD_C;
}

PD_High.SetDefaultColor(color.DARK_ORANGE);
PD_High.SetpaintingStrategy(paintingStrategy.HORIZONTAL);
PD_High.SetLineWeight(2);
PD_High.HideTitle();

PD_Low.SetDefaultColor(color.DARK_ORANGE);
PD_Low.SetpaintingStrategy(paintingStrategy.HORIZONTAL);
PD_Low.SetLineWeight(2);
PD_Low.HideTitle();

PD_Close.SetDefaultColor(color.WHITE);
PD_Close.SetPaintingStrategy(paintingStrategy.HORIZONTAL);
PD_Close.SetLineWeight(2);
PD_Close.HideTitle();

input bubble_placement = {default right_edge, timeopen};

def right_edge = barnumber() == highestall(barnumber() - 1);

DefineGlobalColor("PD_High", CreateColor(255,204,153));
AddChartBubble(ShowBubbles and
if bubble_placement == bubble_placement.timeopen
then timeopen
else right_edge, PD_High, "PD High: " + PD_High, GlobalColor("PD_High"));

DefineGlobalColor("PD_Low", CreateColor(255,204,153));
AddChartBubble(ShowBubbles and
if bubble_placement == bubble_placement.timeopen
then timeopen
else right_edge, PD_Low, "PD Low: " + PD_Low, GlobalColor("PD_Low"), no);

DefineGlobalColor("PD_Close", color.WHITE);
AddChartBubble(ShowBubbles and
if bubble_placement == bubble_placement.timeopen
then timeopen
else right_edge, PD_Close, "PD Close: " + PD_Close, GlobalColor("PD_Close"));


#----- Premarket High/Low -----#

def GlobeX = GetTime() < RegularTradingStart(GetYYYYMMDD());

def vol = if GlobeX and !GlobeX[1]
then v
else if GlobeX
then vol[1] + v
else na;

def GlobeX_Volume = vol;

def ONhigh = if GlobeX and !GlobeX[1]
then h
else if GlobeX and
h > ONhigh[1]
then h
else ONhigh[1];

def ONhighBar = if GlobeX and h == ONhigh
then bn
else na;

def ONlow = if GlobeX and !GlobeX[1]
then l
else if GlobeX and
l < ONlow[1]
then l
else ONlow[1];

def ONlowBar = if GlobeX and l == ONlow
then bn
else na;

def OverNightHigh = if BarNumber() == HighestAll(ONhighBar)
then ONhigh
else OverNightHigh[1];

def OverNightLow = if BarNumber() == HighestAll(ONlowBar)
then ONlow
else OverNightLow[1];

plot PM_High;
plot PM_Low;
def  PM_H = if extend_plots and isnan(close)
            then PM_H[1]
            else if OverNightHigh > 0 then OverNightHigh else na;
def  PM_L = if extend_plots and isnan(close)
            then PM_L[1]
            else if OverNightLow > 0 then OverNightLow else na;
if showOnlyLastPeriod and !IsNaN(close(period = aggregationPeriod)[-1]) {
    PM_High = na;
    PM_Low = na;
} else {
    PM_High = PM_H;
    PM_Low  = PM_L;
}

#PM_High.SetHiding(!PlotOverNightExtremes);
PM_High.SetLineWeight(2);
PM_High.SetDefaultColor(color.CYAN);
PM_High.SetPaintingStrategy(PaintingStrategy.HORIZONTAL);
PM_High.HideBubble();
PM_High.HideTitle();

#PM_Low.SetHiding(!PlotOverNightExtremes);
PM_Low.SetPaintingStrategy(PaintingStrategy.HORIZONTAL);
PM_Low.SetDefaultColor(Color.CYAN);
PM_Low.HideBubble();
PM_Low.HideTitle();

DefineGlobalColor("PM_High", CreateColor(102,255,255));
AddChartBubble(ShowBubbles and right_edge, PM_High, "PM High: " + PM_High, GlobalColor("PM_High"));

DefineGlobalColor("PM_Low", CreateColor(102,255,255));
AddChartBubble(ShowBubbles and right_edge, PM_Low, "PM Low: " + PM_Low, GlobalColor("PM_Low"), no);


#----- Today Open/High/Low -----#

plot High_of_Day;
plot Low_of_Day;
Plot DayOpen;
def DOpen    = if extend_plots and isnan(close)
               then DOpen[1]
               else open(period = aggregationPeriod)[0];
def H_of_Day = if extend_plots and isnan(close)
               then H_of_Day[1]
               else Highest(high(period = aggregationPeriod), length);
def L_of_Day = if extend_plots and isnan(close)
               then L_of_Day[1]
               else Lowest(low(period = aggregationPeriod), length);
if showOnlyLastPeriod and !IsNaN(close(period = aggregationPeriod)[-1]) {
    DayOpen = na;
    High_of_Day = na;
    Low_of_Day = na;
} else {
    DayOpen     = DOpen;
    High_of_Day = H_of_Day;
    Low_of_Day  = L_of_Day;
}

DayOpen.SetDefaultColor (Color.GRAY);
DayOpen.SetPaintingStrategy(PaintingStrategy.DASHES);
DayOpen.SetLineWeight(2);
DayOpen.HideTitle();

High_of_Day.SetDefaultColor(CreateColor(0,128,255));
High_of_Day.SetPaintingStrategy(PaintingStrategy.HORIZONTAL);
High_of_Day.SetLineWeight(2);
High_of_Day.HideTitle();

Low_of_Day.SetDefaultColor(CreateColor(0,128,255));
Low_of_Day.SetPaintingStrategy(PaintingStrategy.HORIZONTAL);
Low_of_Day.SetLineWeight(2);
Low_of_Day.HideTitle();

DefineGlobalColor("Open", color.LIGHT_GRAY);
AddChartBubble(ShowBubbles and
if bubble_placement == bubble_placement.timeopen
then timeopen
else right_edge, DayOpen, "Open: " + DayOpen, GlobalColor("Open"));

DefineGlobalColor("High_of_Day", CreateColor(102,178,255));
AddChartBubble(ShowBubbles and
if bubble_placement == bubble_placement.timeopen
then timeopen
else right_edge, High_of_Day, "High of Day: " + High_of_Day, GlobalColor("High_of_Day"));

DefineGlobalColor("Low_of_Day", CreateColor(102,178,255));
AddChartBubble(ShowBubbles and
if bubble_placement == bubble_placement.timeopen
then timeopen
else right_edge, Low_of_Day, "Low of Day: " + Low_of_Day, GlobalColor("Low_of_Day"), no);
 
@SleepyZ provided the right_edge bubble code. Thank you @Wiinii and @SleepyZ for your incredible work.

Screenshot-2022-11-12-204945.png


# Previous Day High/Low/Close + Premarket High/Low + High/Low/Open of Day
# Some code based on code by Mobius
# Created by Wiinii
# https://usethinkscript.com/threads/...w-high-low-open-of-day-for-thinkorswim.13139/
# https://usethinkscript.com/threads/extend-point-of-control-line-volume-profile.10893/post-112226

declare hide_on_daily;

input extend_plots = yes;
input length = 1;
input showOnlyLastPeriod = yes;
input ShowBubbles = yes;
input locate_bubbles_at_time = 0930;


def bn = BarNumber();
def na = Double.NaN;
def h = high;
def l = low;
def o = open;
def c = close;
def v = volume;
def aggregationPeriod = AggregationPeriod.DAY;
def displace = -1;
def timeopen = SecondsFromTime(locate_bubbles_at_time) == 0;

#----- Previous Day High/Low/Close -----#

plot PD_High;
plot PD_Low;
plot PD_Close;
def PD_H = if extend_plots and isnan(close)
then PD_H[1]
else Highest(high(period = aggregationPeriod)[-displace], length);
def PD_L = if extend_plots and isnan(close)
then PD_L[1]
else Lowest(low(period = aggregationPeriod)[-displace], length);
def PD_C = if extend_plots and isnan(close)
then PD_C[1]
else close(period = aggregationPeriod)[-displace];
if showOnlyLastPeriod and !IsNaN(close(period = aggregationPeriod)[-1]) {
PD_High = na;
PD_Low = na;
PD_Close = na;
} else {
PD_High = PD_H;
PD_Low = PD_L;
PD_Close = PD_C;
}

PD_High.SetDefaultColor(color.DARK_ORANGE);
PD_High.SetpaintingStrategy(paintingStrategy.HORIZONTAL);
PD_High.SetLineWeight(2);
PD_High.HideTitle();

PD_Low.SetDefaultColor(color.DARK_ORANGE);
PD_Low.SetpaintingStrategy(paintingStrategy.HORIZONTAL);
PD_Low.SetLineWeight(2);
PD_Low.HideTitle();

PD_Close.SetDefaultColor(color.WHITE);
PD_Close.SetPaintingStrategy(paintingStrategy.HORIZONTAL);
PD_Close.SetLineWeight(2);
PD_Close.HideTitle();

input bubble_placement = {default right_edge, timeopen};

def right_edge = barnumber() == highestall(barnumber() - 1);

DefineGlobalColor("PD_High", CreateColor(255,204,153));
AddChartBubble(ShowBubbles and
if bubble_placement == bubble_placement.timeopen
then timeopen
else right_edge, PD_High, "PD High: " + PD_High, GlobalColor("PD_High"));

DefineGlobalColor("PD_Low", CreateColor(255,204,153));
AddChartBubble(ShowBubbles and
if bubble_placement == bubble_placement.timeopen
then timeopen
else right_edge, PD_Low, "PD Low: " + PD_Low, GlobalColor("PD_Low"), no);

DefineGlobalColor("PD_Close", color.WHITE);
AddChartBubble(ShowBubbles and
if bubble_placement == bubble_placement.timeopen
then timeopen
else right_edge, PD_Close, "PD Close: " + PD_Close, GlobalColor("PD_Close"));


#----- Premarket High/Low -----#

def GlobeX = GetTime() < RegularTradingStart(GetYYYYMMDD());

def vol = if GlobeX and !GlobeX[1]
then v
else if GlobeX
then vol[1] + v
else na;

def GlobeX_Volume = vol;

def ONhigh = if GlobeX and !GlobeX[1]
then h
else if GlobeX and
h > ONhigh[1]
then h
else ONhigh[1];

def ONhighBar = if GlobeX and h == ONhigh
then bn
else na;

def ONlow = if GlobeX and !GlobeX[1]
then l
else if GlobeX and
l < ONlow[1]
then l
else ONlow[1];

def ONlowBar = if GlobeX and l == ONlow
then bn
else na;

def OverNightHigh = if BarNumber() == HighestAll(ONhighBar)
then ONhigh
else OverNightHigh[1];

def OverNightLow = if BarNumber() == HighestAll(ONlowBar)
then ONlow
else OverNightLow[1];

plot PM_High;
plot PM_Low;
def PM_H = if extend_plots and isnan(close)
then PM_H[1]
else if OverNightHigh > 0 then OverNightHigh else na;
def PM_L = if extend_plots and isnan(close)
then PM_L[1]
else if OverNightLow > 0 then OverNightLow else na;
if showOnlyLastPeriod and !IsNaN(close(period = aggregationPeriod)[-1]) {
PM_High = na;
PM_Low = na;
} else {
PM_High = PM_H;
PM_Low = PM_L;
}

#PM_High.SetHiding(!PlotOverNightExtremes);
PM_High.SetLineWeight(2);
PM_High.SetDefaultColor(color.CYAN);
PM_High.SetPaintingStrategy(PaintingStrategy.HORIZONTAL);
PM_High.HideBubble();
PM_High.HideTitle();

#PM_Low.SetHiding(!PlotOverNightExtremes);
PM_Low.SetPaintingStrategy(PaintingStrategy.HORIZONTAL);
PM_Low.SetDefaultColor(Color.CYAN);
PM_Low.HideBubble();
PM_Low.HideTitle();

DefineGlobalColor("PM_High", CreateColor(102,255,255));
AddChartBubble(ShowBubbles and right_edge, PM_High, "PM High: " + PM_High, GlobalColor("PM_High"));

DefineGlobalColor("PM_Low", CreateColor(102,255,255));
AddChartBubble(ShowBubbles and right_edge, PM_Low, "PM Low: " + PM_Low, GlobalColor("PM_Low"), no);


#----- Today Open/High/Low -----#

plot High_of_Day;
plot Low_of_Day;
Plot DayOpen;
def DOpen = if extend_plots and isnan(close)
then DOpen[1]
else open(period = aggregationPeriod)[0];
def H_of_Day = if extend_plots and isnan(close)
then H_of_Day[1]
else Highest(high(period = aggregationPeriod), length);
def L_of_Day = if extend_plots and isnan(close)
then L_of_Day[1]
else Lowest(low(period = aggregationPeriod), length);
if showOnlyLastPeriod and !IsNaN(close(period = aggregationPeriod)[-1]) {
DayOpen = na;
High_of_Day = na;
Low_of_Day = na;
} else {
DayOpen = DOpen;
High_of_Day = H_of_Day;
Low_of_Day = L_of_Day;
}

DayOpen.SetDefaultColor (Color.GRAY);
DayOpen.SetPaintingStrategy(PaintingStrategy.DASHES);
DayOpen.SetLineWeight(2);
DayOpen.HideTitle();

High_of_Day.SetDefaultColor(CreateColor(0,128,255));
High_of_Day.SetPaintingStrategy(PaintingStrategy.HORIZONTAL);
High_of_Day.SetLineWeight(2);
High_of_Day.HideTitle();

Low_of_Day.SetDefaultColor(CreateColor(0,128,255));
Low_of_Day.SetPaintingStrategy(PaintingStrategy.HORIZONTAL);
Low_of_Day.SetLineWeight(2);
Low_of_Day.HideTitle();

DefineGlobalColor("Open", color.LIGHT_GRAY);
AddChartBubble(ShowBubbles and
if bubble_placement == bubble_placement.timeopen
then timeopen
else right_edge, DayOpen, "Open: " + DayOpen, GlobalColor("Open"));

DefineGlobalColor("High_of_Day", CreateColor(102,178,255));
AddChartBubble(ShowBubbles and
if bubble_placement == bubble_placement.timeopen
then timeopen
else right_edge, High_of_Day, "High of Day: " + High_of_Day, GlobalColor("High_of_Day"));

DefineGlobalColor("Low_of_Day", CreateColor(102,178,255));
AddChartBubble(ShowBubbles and
if bubble_placement == bubble_placement.timeopen
then timeopen
else right_edge, Low_of_Day, "Low of Day: " + Low_of_Day, GlobalColor("Low_of_Day"), no);
 
When I checked the "show extendend-hours trading session," the RTH plots the same location as the Globex hi/low. Would there be a way to get RTH to work properly with the extended hours on?

Thank you in advance.
 
Hmm, maybe when it is outside the Globex range, it works properly. I think when it was inside Globex range, it didnt plot RTH correctly. It just mirrored the Globex range.
 
Hmm, maybe when it is outside the Globex range, it works properly. I think when it was inside Globex range, it didnt plot RTH correctly. It just mirrored the Globex range.

The high/low of the day does not plot until after RTHrs opens. The line does plot back to the same start of the other lines on the left (correction to my saying right appove), so I understand how you might get confused.

So for those that open at 0930, I have made adjustment to the code for the high/low of the day to only plot starting at 0930 and then extended if selected.

The first chart is with the new code. The 2nd is the old code during RTH showing the same value. The 3rd chart is the globex/premarket period and shows that H/L of the Day does not plot until RTHrs.

Below these is the new revised code.

Here is revised code
Ruby:
# Previous Day High/Low/Close + Premarket High/Low + High/Low/Open of Day
# Some code based on code by Mobius
# Created by Wiinii

declare hide_on_daily;

input extend_plots = yes;
input length = 1;
input showOnlyLastPeriod = yes;
input ShowBubbles = yes;
input locate_bubbles_at_time = 0930;


def bn = BarNumber();
def na = Double.NaN;
def h  = high;
def l  = low;
def o = open;
def c = close;
def v = volume;
def aggregationPeriod = AggregationPeriod.DAY;
def displace = -1;
def timeopen = SecondsFromTime(locate_bubbles_at_time) == 0;

#----- Previous Day High/Low/Close -----#

plot PD_High;
plot PD_Low;
plot PD_Close;
def PD_H = if extend_plots and isnan(close)
           then PD_H[1]
           else Highest(high(period = aggregationPeriod)[-displace], length);
def PD_L = if extend_plots and isnan(close)
           then PD_L[1]
           else Lowest(low(period = aggregationPeriod)[-displace], length);
def PD_C = if extend_plots and isnan(close)
           then PD_C[1]
           else close(period = aggregationPeriod)[-displace];
if showOnlyLastPeriod and !IsNaN(close(period = aggregationPeriod)[-1]) {
    PD_High = na;
    PD_Low = na;
    PD_Close = na;
} else {
    PD_High  = PD_H;
    PD_Low   = PD_L;
    PD_Close = PD_C;
}

PD_High.SetDefaultColor(color.DARK_ORANGE);
PD_High.SetpaintingStrategy(paintingStrategy.HORIZONTAL);
PD_High.SetLineWeight(2);
PD_High.HideTitle();

PD_Low.SetDefaultColor(color.DARK_ORANGE);
PD_Low.SetpaintingStrategy(paintingStrategy.HORIZONTAL);
PD_Low.SetLineWeight(2);
PD_Low.HideTitle();

PD_Close.SetDefaultColor(color.WHITE);
PD_Close.SetPaintingStrategy(paintingStrategy.HORIZONTAL);
PD_Close.SetLineWeight(2);
PD_Close.HideTitle();

input bubble_placement = {default right_edge, timeopen};

def right_edge = barnumber() == highestall(barnumber() - 1);

DefineGlobalColor("PD_High", CreateColor(255,204,153));
AddChartBubble(ShowBubbles and
if bubble_placement == bubble_placement.timeopen
then timeopen
else right_edge, PD_High, "PD High: " + PD_High, GlobalColor("PD_High"));

DefineGlobalColor("PD_Low", CreateColor(255,204,153));
AddChartBubble(ShowBubbles and
if bubble_placement == bubble_placement.timeopen
then timeopen
else right_edge, PD_Low, "PD Low: " + PD_Low, GlobalColor("PD_Low"), no);

DefineGlobalColor("PD_Close", color.WHITE);
AddChartBubble(ShowBubbles and
if bubble_placement == bubble_placement.timeopen
then timeopen
else right_edge, PD_Close, "PD Close: " + PD_Close, GlobalColor("PD_Close"));


#----- Premarket High/Low -----#

def GlobeX = GetTime() < RegularTradingStart(GetYYYYMMDD());

def vol = if GlobeX and !GlobeX[1]
then v
else if GlobeX
then vol[1] + v
else na;

def GlobeX_Volume = vol;

def ONhigh = if GlobeX and !GlobeX[1]
then h
else if GlobeX and
h > ONhigh[1]
then h
else ONhigh[1];

def ONhighBar = if GlobeX and h == ONhigh
then bn
else na;

def ONlow = if GlobeX and !GlobeX[1]
then l
else if GlobeX and
l < ONlow[1]
then l
else ONlow[1];

def ONlowBar = if GlobeX and l == ONlow
then bn
else na;

def OverNightHigh = if BarNumber() == HighestAll(ONhighBar)
then ONhigh
else OverNightHigh[1];

def OverNightLow = if BarNumber() == HighestAll(ONlowBar)
then ONlow
else OverNightLow[1];

plot PM_High;
plot PM_Low;
def  PM_H = if extend_plots and isnan(close)
            then PM_H[1]
            else if OverNightHigh > 0 then OverNightHigh else na;
def  PM_L = if extend_plots and isnan(close)
            then PM_L[1]
            else if OverNightLow > 0 then OverNightLow else na;
if showOnlyLastPeriod and !IsNaN(close(period = aggregationPeriod)[-1]) {
    PM_High = na;
    PM_Low = na;
} else {
    PM_High = PM_H;
    PM_Low  = PM_L;
}

#PM_High.SetHiding(!PlotOverNightExtremes);
PM_High.SetLineWeight(2);
PM_High.SetDefaultColor(color.CYAN);
PM_High.SetPaintingStrategy(PaintingStrategy.HORIZONTAL);
PM_High.HideBubble();
PM_High.HideTitle();

#PM_Low.SetHiding(!PlotOverNightExtremes);
PM_Low.SetPaintingStrategy(PaintingStrategy.HORIZONTAL);
PM_Low.SetDefaultColor(Color.CYAN);
PM_Low.HideBubble();
PM_Low.HideTitle();

DefineGlobalColor("PM_High", CreateColor(102,255,255));
AddChartBubble(ShowBubbles and right_edge, PM_High, "PM High: " + PM_High, GlobalColor("PM_High"));

DefineGlobalColor("PM_Low", CreateColor(102,255,255));
AddChartBubble(ShowBubbles and right_edge, PM_Low, "PM Low: " + PM_Low, GlobalColor("PM_Low"), no);


#----- Today Open/High/Low -----#

plot High_of_Day;
plot Low_of_Day;
Plot DayOpen;
def DOpen    = if extend_plots and isnan(close)
               then DOpen[1]
               else open(period = aggregationPeriod)[0];
def H_of_Day = if extend_plots and isnan(close)
               then H_of_Day[1]
               else if secondsfromtime(0930) >= 0
               then Highest(high(period = aggregationPeriod), length)
               else double.nan;
def L_of_Day = if extend_plots and isnan(close)
               then L_of_Day[1]
               else  if secondsfromtime(0930) >= 0
               then Lowest(low(period = aggregationPeriod), length)
               else double.nan;
if showOnlyLastPeriod and !IsNaN(close(period = aggregationPeriod)[-1]) {
    DayOpen = na;
    High_of_Day = na;
    Low_of_Day = na;
} else {
    DayOpen     = DOpen;
    High_of_Day = H_of_Day;
    Low_of_Day  = L_of_Day;
}

DayOpen.SetDefaultColor (Color.GRAY);
DayOpen.SetPaintingStrategy(PaintingStrategy.DASHES);
DayOpen.SetLineWeight(2);
DayOpen.HideTitle();

High_of_Day.SetDefaultColor(CreateColor(0,128,255));
High_of_Day.SetPaintingStrategy(PaintingStrategy.HORIZONTAL);
High_of_Day.SetLineWeight(2);
High_of_Day.HideTitle();

Low_of_Day.SetDefaultColor(CreateColor(0,128,255));
Low_of_Day.SetPaintingStrategy(PaintingStrategy.HORIZONTAL);
Low_of_Day.SetLineWeight(2);
Low_of_Day.HideTitle();

DefineGlobalColor("Open", color.LIGHT_GRAY);
AddChartBubble(ShowBubbles and
if bubble_placement == bubble_placement.timeopen
then timeopen
else right_edge, DayOpen, "Open: " + DayOpen, GlobalColor("Open"));

DefineGlobalColor("High_of_Day", CreateColor(102,178,255));
AddChartBubble(ShowBubbles and
if bubble_placement == bubble_placement.timeopen
then timeopen
else right_edge, High_of_Day, "High of Day: " + High_of_Day, GlobalColor("High_of_Day"));

DefineGlobalColor("Low_of_Day", CreateColor(102,178,255));
AddChartBubble(ShowBubbles and
if bubble_placement == bubble_placement.timeopen
then timeopen
else right_edge, Low_of_Day, "Low of Day: " + Low_of_Day, GlobalColor("Low_of_Day"), no);
 

Attachments

  • Screenshot-2022-12-01-171037.png
    Screenshot-2022-12-01-171037.png
    311.3 KB · Views: 2,748
Would it be possible to modify the code so that the indicator lines appear in the right expansion area instead of across the whole chart?
 
Would it be possible to modify the code so that the indicator lines appear in the right expansion area instead of across the whole chart?

Sure,

Screenshot-2022-12-02-063112.png
Ruby:
# Previous Day High/Low/Close + Premarket High/Low + High/Low/Open of Day
# Some code based on code by Mobius
# Created by Wiinii
# Sleepyz added input option coding

declare hide_on_daily;

input extend_plots       = yes;
input length             = 1;
input showOnlyLastPeriod = yes;
input showexpansiononly  = no;
input ShowBubbles        = yes;
input locate_bubbles_at_time = 0930;


def bn = BarNumber();
def na = Double.NaN;
def h  = high;
def l  = low;
def o = open;
def c = close;
def v = volume;
def aggregationPeriod = AggregationPeriod.DAY;
def displace = -1;
def timeopen = SecondsFromTime(locate_bubbles_at_time) == 0;

#----- Previous Day High/Low/Close -----#

plot PD_High;
plot PD_Low;
plot PD_Close;
def PD_H = if extend_plots and isnan(close)
           then PD_H[1]
           else Highest(high(period = aggregationPeriod)[-displace], length);
def PD_L = if extend_plots and isnan(close)
           then PD_L[1]
           else Lowest(low(period = aggregationPeriod)[-displace], length);
def PD_C = if extend_plots and isnan(close)
           then PD_C[1]
           else close(period = aggregationPeriod)[-displace];
if showOnlyLastPeriod and !IsNaN(close(period = aggregationPeriod)[-1]) {
    PD_High = na;
    PD_Low = na;
    PD_Close = na;
} else {
    PD_High  = if showexpansiononly and !IsNaN(close)
               then Double.NaN
               else PD_H;
    PD_Low   = if showexpansiononly and !IsNaN(close)
               then Double.NaN
               else PD_L;
    PD_Close = if showexpansiononly and !IsNaN(close)
               then Double.NaN
               else PD_C;
}

PD_High.SetDefaultColor(color.DARK_ORANGE);
PD_High.SetpaintingStrategy(paintingStrategy.HORIZONTAL);
PD_High.SetLineWeight(2);
PD_High.HideTitle();

PD_Low.SetDefaultColor(color.DARK_ORANGE);
PD_Low.SetpaintingStrategy(paintingStrategy.HORIZONTAL);
PD_Low.SetLineWeight(2);
PD_Low.HideTitle();

PD_Close.SetDefaultColor(color.WHITE);
PD_Close.SetPaintingStrategy(paintingStrategy.HORIZONTAL);
PD_Close.SetLineWeight(2);
PD_Close.HideTitle();

input bubble_placement = {default right_edge, timeopen};

def right_edge = barnumber() == highestall(barnumber() - 1);

DefineGlobalColor("PD_High", CreateColor(255,204,153));
AddChartBubble(ShowBubbles and
if bubble_placement == bubble_placement.timeopen
then timeopen
else right_edge, PD_High, "PD High: " + PD_High, GlobalColor("PD_High"));

DefineGlobalColor("PD_Low", CreateColor(255,204,153));
AddChartBubble(ShowBubbles and
if bubble_placement == bubble_placement.timeopen
then timeopen
else right_edge, PD_Low, "PD Low: " + PD_Low, GlobalColor("PD_Low"), no);

DefineGlobalColor("PD_Close", color.WHITE);
AddChartBubble(ShowBubbles and
if bubble_placement == bubble_placement.timeopen
then timeopen
else right_edge, PD_Close, "PD Close: " + PD_Close, GlobalColor("PD_Close"));


#----- Premarket High/Low -----#

def GlobeX = GetTime() < RegularTradingStart(GetYYYYMMDD());

def vol = if GlobeX and !GlobeX[1]
then v
else if GlobeX
then vol[1] + v
else na;

def GlobeX_Volume = vol;

def ONhigh = if GlobeX and !GlobeX[1]
then h
else if GlobeX and
h > ONhigh[1]
then h
else ONhigh[1];

def ONhighBar = if GlobeX and h == ONhigh
then bn
else na;

def ONlow = if GlobeX and !GlobeX[1]
then l
else if GlobeX and
l < ONlow[1]
then l
else ONlow[1];

def ONlowBar = if GlobeX and l == ONlow
then bn
else na;

def OverNightHigh = if BarNumber() == HighestAll(ONhighBar)
then ONhigh
else OverNightHigh[1];

def OverNightLow = if BarNumber() == HighestAll(ONlowBar)
then ONlow
else OverNightLow[1];

plot PM_High;
plot PM_Low;
def  PM_H = if extend_plots and isnan(close)
            then PM_H[1]
            else if OverNightHigh > 0 then OverNightHigh else na;
def  PM_L = if extend_plots and isnan(close)
            then PM_L[1]
            else if OverNightLow > 0 then OverNightLow else na;
if showOnlyLastPeriod and !IsNaN(close(period = aggregationPeriod)[-1]) {
    PM_High = na;
    PM_Low = na;
} else {
    PM_High = if showexpansiononly and !IsNaN(close)
              then Double.NaN
              else PM_H;
    PM_Low  = if showexpansiononly and !IsNaN(close)
              then Double.NaN
              else PM_L;
}

#PM_High.SetHiding(!PlotOverNightExtremes);
PM_High.SetLineWeight(2);
PM_High.SetDefaultColor(color.CYAN);
PM_High.SetPaintingStrategy(PaintingStrategy.HORIZONTAL);
PM_High.HideBubble();
PM_High.HideTitle();

#PM_Low.SetHiding(!PlotOverNightExtremes);
PM_Low.SetPaintingStrategy(PaintingStrategy.HORIZONTAL);
PM_Low.SetDefaultColor(Color.CYAN);
PM_Low.HideBubble();
PM_Low.HideTitle();

DefineGlobalColor("PM_High", CreateColor(102,255,255));
AddChartBubble(ShowBubbles and right_edge, PM_High, "PM High: " + PM_High, GlobalColor("PM_High"));

DefineGlobalColor("PM_Low", CreateColor(102,255,255));
AddChartBubble(ShowBubbles and right_edge, PM_Low, "PM Low: " + PM_Low, GlobalColor("PM_Low"), no);


#----- Today Open/High/Low -----#

plot High_of_Day;
plot Low_of_Day;
Plot DayOpen;
def DOpen    = if extend_plots and isnan(close)
               then DOpen[1]
               else open(period = aggregationPeriod)[0];
def H_of_Day = if extend_plots and isnan(close)
               then H_of_Day[1]
               else if secondsfromtime(0930) >= 0
               then Highest(high(period = aggregationPeriod), length)
               else double.nan;
def L_of_Day = if extend_plots and isnan(close)
               then L_of_Day[1]
               else  if secondsfromtime(0930) >= 0
               then Lowest(low(period = aggregationPeriod), length)
               else double.nan;
if showOnlyLastPeriod and !IsNaN(close(period = aggregationPeriod)[-1]) {
    DayOpen = na;
    High_of_Day = na;
    Low_of_Day = na;
} else {
    DayOpen     = if showexpansiononly and !IsNaN(close)
                  then Double.NaN
                  else DOpen;
    High_of_Day = if showexpansiononly and !IsNaN(close)
                  then Double.NaN
                  else H_of_Day;
    Low_of_Day  = if showexpansiononly and !IsNaN(close)
                  then Double.NaN
                  else L_of_Day;
}

DayOpen.SetDefaultColor (Color.GRAY);
DayOpen.SetPaintingStrategy(PaintingStrategy.DASHES);
DayOpen.SetLineWeight(2);
DayOpen.HideTitle();

High_of_Day.SetDefaultColor(CreateColor(0,128,255));
High_of_Day.SetPaintingStrategy(PaintingStrategy.HORIZONTAL);
High_of_Day.SetLineWeight(2);
High_of_Day.HideTitle();

Low_of_Day.SetDefaultColor(CreateColor(0,128,255));
Low_of_Day.SetPaintingStrategy(PaintingStrategy.HORIZONTAL);
Low_of_Day.SetLineWeight(2);
Low_of_Day.HideTitle();

DefineGlobalColor("Open", color.LIGHT_GRAY);
AddChartBubble(ShowBubbles and
if bubble_placement == bubble_placement.timeopen
then timeopen
else right_edge, DayOpen, "Open: " + DayOpen, GlobalColor("Open"));

DefineGlobalColor("High_of_Day", CreateColor(102,178,255));
AddChartBubble(ShowBubbles and
if bubble_placement == bubble_placement.timeopen
then timeopen
else right_edge, High_of_Day, "High of Day: " + High_of_Day, GlobalColor("High_of_Day"));

DefineGlobalColor("Low_of_Day", CreateColor(102,178,255));
AddChartBubble(ShowBubbles and
if bubble_placement == bubble_placement.timeopen
then timeopen
else right_edge, Low_of_Day, "Low of Day: " + Low_of_Day, GlobalColor("Low_of_Day"), no);
 
The high/low of the day does not plot until after RTHrs opens. The line does plot back to the same start of the other lines on the left (correction to my saying right appove), so I understand how you might get confused.

So for those that open at 0930, I have made adjustment to the code for the high/low of the day to only plot starting at 0930 and then extended if selected.

The first chart is with the new code. The 2nd is the old code during RTH showing the same value. The 3rd chart is the globex/premarket period and shows that H/L of the Day does not plot until RTHrs.

Below these is the new revised code.


Here is revised code
Hello,
My High of the Day and PM High is 4075.75 on ES, with extended hours on. Without extended hours on, HOD is 4055.50.
Globex doesnt plot when you turn off extended hours? Is that a limitation on ToS?
 
Last edited:
@SleepyZ or anyone else available to edit the original, would it be possible to get a pre-market high/low mid-point added? In the example you shared, it's almost the exact level price found resistance at into the open around the 0935-0940 area. Would be most appreciated if anyone could plug that in 🤟
 
@SleepyZ or anyone else available to edit the original, would it be possible to get a pre-market high/low mid-point added? In the example you shared, it's almost the exact level price found resistance at into the open around the 0935-0940 area. Would be most appreciated if anyone could plug that in 🤟

Sure, PM_Mid added

Screenshot-2022-12-10-151727.png

@SleepyZ or anyone else available to edit the original, would it be possible to get a pre-market high/low mid-point added? In the example you shared, it's almost the exact level price found resistance at into the open around the 0935-0940 area. Would be most appreciated if anyone could plug that in 🤟

Ruby:
# Previous Day High/Low/Close + Premarket High/Low + High/Low/Open of Day
# Some code based on code by Mobius
# Created by Wiinii
# Sleepyz added input option coding
# PM_Mid added

declare hide_on_daily;

input extend_plots       = yes;
input length             = 1;
input showOnlyLastPeriod = yes;
input showexpansiononly  = no;
input ShowBubbles        = yes;
input locate_bubbles_at_time = 0930;


def bn = BarNumber();
def na = Double.NaN;
def h  = high;
def l  = low;
def o = open;
def c = close;
def v = volume;
def aggregationPeriod = AggregationPeriod.DAY;
def displace = -1;
def timeopen = SecondsFromTime(locate_bubbles_at_time) == 0;

#----- Previous Day High/Low/Close -----#

plot PD_High;
plot PD_Low;
plot PD_Close;
def PD_H = if extend_plots and isnan(close)
           then PD_H[1]
           else Highest(high(period = aggregationPeriod)[-displace], length);
def PD_L = if extend_plots and isnan(close)
           then PD_L[1]
           else Lowest(low(period = aggregationPeriod)[-displace], length);
def PD_C = if extend_plots and isnan(close)
           then PD_C[1]
           else close(period = aggregationPeriod)[-displace];
if showOnlyLastPeriod and !IsNaN(close(period = aggregationPeriod)[-1]) {
    PD_High = na;
    PD_Low = na;
    PD_Close = na;
} else {
    PD_High  = if showexpansiononly and !IsNaN(close)
               then Double.NaN
               else PD_H;
    PD_Low   = if showexpansiononly and !IsNaN(close)
               then Double.NaN
               else PD_L;
    PD_Close = if showexpansiononly and !IsNaN(close)
               then Double.NaN
               else PD_C;
}

PD_High.SetDefaultColor(color.DARK_ORANGE);
PD_High.SetpaintingStrategy(paintingStrategy.HORIZONTAL);
PD_High.SetLineWeight(2);
PD_High.HideTitle();

PD_Low.SetDefaultColor(color.DARK_ORANGE);
PD_Low.SetpaintingStrategy(paintingStrategy.HORIZONTAL);
PD_Low.SetLineWeight(2);
PD_Low.HideTitle();

PD_Close.SetDefaultColor(color.WHITE);
PD_Close.SetPaintingStrategy(paintingStrategy.HORIZONTAL);
PD_Close.SetLineWeight(2);
PD_Close.HideTitle();

input bubble_placement = {default right_edge, timeopen};

def right_edge = barnumber() == highestall(barnumber() - 1);

DefineGlobalColor("PD_High", CreateColor(255,204,153));
AddChartBubble(ShowBubbles and
if bubble_placement == bubble_placement.timeopen
then timeopen
else right_edge, PD_High, "PD High: " + PD_High, GlobalColor("PD_High"));

DefineGlobalColor("PD_Low", CreateColor(255,204,153));
AddChartBubble(ShowBubbles and
if bubble_placement == bubble_placement.timeopen
then timeopen
else right_edge, PD_Low, "PD Low: " + PD_Low, GlobalColor("PD_Low"), no);

DefineGlobalColor("PD_Close", color.WHITE);
AddChartBubble(ShowBubbles and
if bubble_placement == bubble_placement.timeopen
then timeopen
else right_edge, PD_Close, "PD Close: " + PD_Close, GlobalColor("PD_Close"));


#----- Premarket High/Low -----#

def GlobeX = GetTime() < RegularTradingStart(GetYYYYMMDD());

def vol = if GlobeX and !GlobeX[1]
then v
else if GlobeX
then vol[1] + v
else na;

def GlobeX_Volume = vol;

def ONhigh = if GlobeX and !GlobeX[1]
then h
else if GlobeX and
h > ONhigh[1]
then h
else ONhigh[1];

def ONhighBar = if GlobeX and h == ONhigh
then bn
else na;

def ONlow = if GlobeX and !GlobeX[1]
then l
else if GlobeX and
l < ONlow[1]
then l
else ONlow[1];

def ONlowBar = if GlobeX and l == ONlow
then bn
else na;

def OverNightHigh = if BarNumber() == HighestAll(ONhighBar)
then ONhigh
else OverNightHigh[1];

def OverNightLow = if BarNumber() == HighestAll(ONlowBar)
then ONlow
else OverNightLow[1];

plot PM_High;
plot PM_Low;
plot PM_Mid;
def  PM_H = if extend_plots and isnan(close)
            then PM_H[1]
            else if OverNightHigh > 0 then OverNightHigh else na;
def  PM_L = if extend_plots and isnan(close)
            then PM_L[1]
            else if OverNightLow > 0 then OverNightLow else na;
if showOnlyLastPeriod and !IsNaN(close(period = aggregationPeriod)[-1]) {
    PM_High = na;
    PM_Low = na;
    PM_Mid = na;
} else {
    PM_High = if showexpansiononly and !IsNaN(close)
              then Double.NaN
              else PM_H;
    PM_Low  = if showexpansiononly and !IsNaN(close)
              then Double.NaN
              else PM_L;
    PM_Mid  = if showexpansiononly and !IsNaN(close)
              then Double.NaN
              else (PM_H + PM_L) / 2;
}

#PM_High.SetHiding(!PlotOverNightExtremes);
PM_High.SetLineWeight(2);
PM_High.SetDefaultColor(color.CYAN);
PM_High.SetPaintingStrategy(PaintingStrategy.HORIZONTAL);
PM_High.HideBubble();
PM_High.HideTitle();

#PM_Low.SetHiding(!PlotOverNightExtremes);
PM_Low.SetPaintingStrategy(PaintingStrategy.HORIZONTAL);
PM_Low.SetDefaultColor(Color.CYAN);
PM_Low.HideBubble();
PM_Low.HideTitle();

#PM_Mid.SetHiding(!PlotOverNightExtremes);
PM_Mid.SetPaintingStrategy(PaintingStrategy.HORIZONTAL);
PM_Mid.SetDefaultColor(Color.CYAN);
PM_Mid.HideBubble();
PM_Mid.HideTitle();

DefineGlobalColor("PM_High", CreateColor(102,255,255));
AddChartBubble(ShowBubbles and right_edge, PM_High, "PM High: " + PM_High, GlobalColor("PM_High"));

DefineGlobalColor("PM_Low", CreateColor(102,255,255));
AddChartBubble(ShowBubbles and right_edge, PM_Low, "PM Low: " + PM_Low, GlobalColor("PM_Low"), no);

DefineGlobalColor("PM_Mid", CreateColor(102,255,255));
AddChartBubble(ShowBubbles and right_edge, PM_Mid, "PM Mid: " + PM_Mid, GlobalColor("PM_Mid"));


#----- Today Open/High/Low -----#

plot High_of_Day;
plot Low_of_Day;
Plot DayOpen;
def DOpen    = if extend_plots and isnan(close)
               then DOpen[1]
               else open(period = aggregationPeriod)[0];
def H_of_Day = if extend_plots and isnan(close)
               then H_of_Day[1]
               else if secondsfromtime(0930) >= 0
               then Highest(high(period = aggregationPeriod), length)
               else double.nan;
def L_of_Day = if extend_plots and isnan(close)
               then L_of_Day[1]
               else  if secondsfromtime(0930) >= 0
               then Lowest(low(period = aggregationPeriod), length)
               else double.nan;
if showOnlyLastPeriod and !IsNaN(close(period = aggregationPeriod)[-1]) {
    DayOpen = na;
    High_of_Day = na;
    Low_of_Day = na;
} else {
    DayOpen     = if showexpansiononly and !IsNaN(close)
                  then Double.NaN
                  else DOpen;
    High_of_Day = if showexpansiononly and !IsNaN(close)
                  then Double.NaN
                  else H_of_Day;
    Low_of_Day  = if showexpansiononly and !IsNaN(close)
                  then Double.NaN
                  else L_of_Day;
}

DayOpen.SetDefaultColor (Color.GRAY);
DayOpen.SetPaintingStrategy(PaintingStrategy.DASHES);
DayOpen.SetLineWeight(2);
DayOpen.HideTitle();

High_of_Day.SetDefaultColor(CreateColor(0,128,255));
High_of_Day.SetPaintingStrategy(PaintingStrategy.HORIZONTAL);
High_of_Day.SetLineWeight(2);
High_of_Day.HideTitle();

Low_of_Day.SetDefaultColor(CreateColor(0,128,255));
Low_of_Day.SetPaintingStrategy(PaintingStrategy.HORIZONTAL);
Low_of_Day.SetLineWeight(2);
Low_of_Day.HideTitle();

DefineGlobalColor("Open", color.LIGHT_GRAY);
AddChartBubble(ShowBubbles and
if bubble_placement == bubble_placement.timeopen
then timeopen
else right_edge, DayOpen, "Open: " + DayOpen, GlobalColor("Open"));

DefineGlobalColor("High_of_Day", CreateColor(102,178,255));
AddChartBubble(ShowBubbles and
if bubble_placement == bubble_placement.timeopen
then timeopen
else right_edge, High_of_Day, "High of Day: " + High_of_Day, GlobalColor("High_of_Day"));

DefineGlobalColor("Low_of_Day", CreateColor(102,178,255));
AddChartBubble(ShowBubbles and
if bubble_placement == bubble_placement.timeopen
then timeopen
else right_edge, Low_of_Day, "Low of Day: " + Low_of_Day, GlobalColor("Low_of_Day"), no);
 
Sure, PM_Mid added
SleepyZ, Is there a way to set all of Pre market to after hours time? What I would like to be able to happen is the entire premarket/after hours be separate from open time. So when High of day is registered, it is only the High of day from 9:30 open time to 4 PM close time. Does this make since?
 
SleepyZ, Is there a way to set all of Pre market to after hours time? What I would like to be able to happen is the entire premarket/after hours be separate from open time. So when High of day is registered, it is only the High of day from 9:30 open time to 4 PM close time. Does this make since?

Related question! Can the regular trading hours be specified in the script, so that it can be used on futures charts?
 

Join useThinkScript to post your question to a community of 21,000+ developers and traders.

Similar threads

Not the exact question you're looking for?

Start a new thread and receive assistance from our community.

87k+ Posts
518 Online
Create Post

Similar threads

Similar threads

The Market Trading Game Changer

Join 2,500+ subscribers inside the useThinkScript VIP Membership Club
  • Exclusive indicators
  • Proven strategies & setups
  • Private Discord community
  • ‘Buy The Dip’ signal alerts
  • Exclusive members-only content
  • Add-ons and resources
  • 1 full year of unlimited support

Frequently Asked Questions

What is useThinkScript?

useThinkScript is the #1 community of stock market investors using indicators and other tools to power their trading strategies. Traders of all skill levels use our forums to learn about scripting and indicators, help each other, and discover new ways to gain an edge in the markets.

How do I get started?

We get it. Our forum can be intimidating, if not overwhelming. With thousands of topics, tens of thousands of posts, our community has created an incredibly deep knowledge base for stock traders. No one can ever exhaust every resource provided on our site.

If you are new, or just looking for guidance, here are some helpful links to get you started.

What are the benefits of VIP Membership?
VIP members get exclusive access to these proven and tested premium indicators: Buy the Dip, Advanced Market Moves 2.0, Take Profit, and Volatility Trading Range. In addition, VIP members get access to over 50 VIP-only custom indicators, add-ons, and strategies, private VIP-only forums, private Discord channel to discuss trades and strategies in real-time, customer support, trade alerts, and much more. Learn all about VIP membership here.
How can I access the premium indicators?
To access the premium indicators, which are plug and play ready, sign up for VIP membership here.
Back
Top