
@BenTen Is there a script available for after hours H/L i only have come across Pre Market H/L .
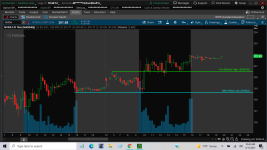
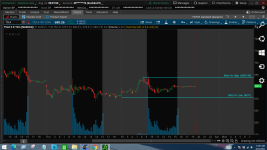
Perhaps this might help for stocks. It uses the modified volume profile script to generate the highs/lows.
 Ruby:
Ruby:input afterbegin = 1600; input afterend = 2359; def aftermarket = SecondsFromTime(afterbegin) > 0 and SecondsTillTime(afterend) >= 0; def bars = 2000; input pricePerRowHeightMode = { AUTOMATIC, default TICKSIZE, CUSTOM}; input customRowHeight = 1.0; input timePerProfile = {default BAR}; input onExpansion = no; input profiles = 1000; def period; switch (timePerProfile) { case BAR: period = BarNumber() - 1; } def count = CompoundValue(1, if aftermarket and period != period[1] then (count[1] + period - period[1]) % bars else count[1], 0); def cond = count < count[1] + period - period[1]; def height; switch (pricePerRowHeightMode) { case AUTOMATIC: height = PricePerRow.AUTOMATIC; case TICKSIZE: height = PricePerRow.TICKSIZE; case CUSTOM: height = customRowHeight; } profile vol = VolumeProfile("startNewProfile" = cond, "onExpansion" = no, "numberOfProfiles" = 1000, "pricePerRow" = height, "value area percent" = 0); def con = CompoundValue(1, onExpansion, no); def hProfile = if aftermarket and IsNaN(vol.GetHighest()) and con then hProfile[1] else vol.GetHighest(); def lProfile = if aftermarket and IsNaN(vol.GetLowest()) and con then lProfile[1] else vol.GetLowest(); def plotsDomain = IsNaN(close) == onExpansion; def ProfileHigh = if aftermarket and plotsDomain then hProfile else Double.NaN; def ProfileLow = if aftermarket and plotsDomain then lProfile else Double.NaN; plot hrange = ProfileHigh; plot lrange = ProfileLow; hrange.SetPaintingStrategy(PaintingStrategy.HORIZONTAL); lrange.SetPaintingStrategy(PaintingStrategy.HORIZONTAL); hrange.SetDefaultColor(Color.GREEN); lrange.SetDefaultColor(Color.RED); hrange.SetLineWeight(2); lrange.SetLineWeight(2); input bubblemover = 3; def b = bubblemover; def b1 = b + 1; input showbubbles = yes; AddChartBubble(showbubbles and (IsNaN(hrange[b1]) and hrange[b]) , hrange, AsText(hrange), Color.LIGHT_GREEN); AddChartBubble(showbubbles and (IsNaN(hrange[b1]) and hrange[b]) , lrange, AsText(lrange), Color.LIGHT_RED, up = no); input showverticalline = yes; AddVerticalLine(showverticalline and hrange != hrange[1], "", Color.BLUE, stroke = Curve.FIRM);
")