RobertPayne
Member
I would like to contribute to this forum by offering to answer questions for those of you who are coding your own indicators. If you are stuck on something, perhaps I can help you figure it out.
You are him, from fun w/ thinkscript??
@RobertPayne TOS coders in Nebraska told me that creating a % Above 200 SMA of S&P 500 cannot currently be done. Using the S&P 100, Do you happen to know if there is a workaround for creating a chart like this?
Thank you.
We can do it w Hi's/Low's per below but not % Above xxDayMA. I could list all 100 stocks and create a ratio, I suppose, but not sure.
https://tos.mx/VhAvab
lol - you will have the TOS Gods hunting for youYou would have to assign the closing price of each and every one of the 500 stocks in your script, then run calculations on each. Similar to the way you have done the dozen or so stocks in your example above. With that many stocks, you would probably run into the "script too long" error and would most certainly bring TOS to its knees. It would be far too slow to be of any use---and that's assuming it ever finished the calculations.
That's awesome to see you around, I really admire your work. I'm working on something that's going to aim to be an MTF Div w/ Master Key. Going to try to knock my head against a wall and see if I make it work but if I get too caught up I may come back and take up your offer.Yes.
@RobertPayne - I don't have a question about a script per se. I was wondering if it's possible to have a Candle Plot MTF indicator? Here's a link that shows what I'm referring to - https://www.tradingview.com/chart/EURUSD/CI3qgX6c-Candle-Plot-MTF-Introduction/
When this is complete would you please post the finished script ? Many Thanks.I cannot figure out why this does not produce angle in degrees. not like trigonometry was ever my strong point but it seems straightforward yet I dont get right result:
Code:def height = MiddleLR - lowest(middleLR,length); def Angle = ATan(height/length)*180/Double.Pi; addlabel(yes,angle +"h:"+height, if angle >anglemin then color.green else if angle<-anglemin then color.red else color.gray);
def isRollover = GetYYYYMMDD() != GetYYYYMMDD()[1];
def beforeStart = GetTime() < RegularTradingStart(GetYYYYMMDD());
def bar1 = if (beforeStart[1] == 1 and beforeStart == 0) or (isRollover and beforeStart == 0) then 1 else 0;
def bar2 = if (beforeStart[2] == 1 and beforeStart[1] == 0) or (isRollover[1] and beforeStart[1] == 0) then 1 else 0;
def bar3 = if (beforeStart[3] == 1 and beforeStart[2] == 0) or (isRollover[2] and beforeStart[2] == 0) then 1 else 0;
def bar4 = if (beforeStart[4] == 1 and beforeStart[3] == 0) or (isRollover[3] and beforeStart[3] == 0) then 1 else 0;
def brk = if bar1 then open else if bar2 or bar3 or bar4 then open[1] else
if (close>brk[1] and close>close[1]) or (close<brk[1] and close<close[1]) then open[4] else brk[1];
def hi = if bar1 then if close > open then close else open else if bar2 or bar3 or bar4 then hi[1] else
if open[1] <= brk[1] and close > brk[1] then open else hi[1];
def lo = if bar1 then if close > open then open else open else if bar2 or bar3 or bar4 then lo[1] else
if open[1] >= brk[1] and close < brk[1] then close else lo[1];
def dir = if bar1 or bar2 or bar3 then 0 else if bar4 then (if close < open[4] then -1 else if close > open[4] then 1 else 0) else
if close>brk then 1 else if close<brk then -1 else dir[1];
plot dir_plot = round(dir,0);
dir_plot.SetPaintingStrategy(PaintingStrategy.VALUES_ABOVE);
dir_plot.SetDefaultColor(Color.white);
def brk = if bar1 then open else if bar2 or bar3 or bar4 then open[1] else
if (close>brk[1] and close>close[1]) or (close<brk[1] and close<close[1]) then open[4] else brk[1];
def brk = if bar1 then open else if bar2 or bar3 or bar4 then open[1] else
if (close>brk[1] and close>hi[1]) or (close<brk[1] and close<lo[1]) then open[4] else brk[1];
But of course, I can't refer to 'hi' and 'lo' before defining them. Any suggestions on how to get around this? I feel like this isn't that hard an issue but I just can't see the solution.
def brk;
def hi;
def lo;
def dir;
brk = if bar1 then open else if bar2 or bar3 or bar4 then open[1] else
if (close>brk[1] and close>hi[1]) or (close<brk[1] and close<lo[1]) then open[4] else brk[1];
hi = if bar1 then if close > open then close else open else if bar2 or bar3 or bar4 then hi[1] else
if open[1] <= brk[1] and close > brk[1] then open else hi[1];
lo = if bar1 then if close > open then open else open else if bar2 or bar3 or bar4 then lo[1] else
if open[1] >= brk[1] and close < brk[1] then close else lo[1];
dir = if bar1 or bar2 or bar3 then 0 else if bar4 then (if close < open[4] then -1 else if close > open[4] then 1 else 0) else
if close>brk then 1 else if close<brk then -1 else dir[1];
Whaaat. Simple answer but I had no idea you could do that. Thanks a million!You can define the variables first.
# +--------------------------------------------------+
# | Example showing how to hide a plot when the |
# | most recent close is not within a certain range. |
# | robert payne |
# | [rrpayne.blogspot.com] |
# +--------------------------------------------------+
# | define a peak and plot it
input magnitude = 5;
def peak = high > Highest(high[1], magnitude) and high >= Highest(high[-magnitude], magnitude);
def peakValue = if peak then high else peakValue[1];
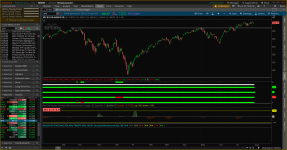
plot peakLine = peakValue;
peakLine.SetPaintingStrategy(PaintingStrategy.HORIZONTAL);
peakLine.SetDefaultColor(Color.green);
# | get the bar numbers for the most recent close
# | and the most recent peak
def lastBar = HighestAll(if IsNaN(close) then 0 else BarNumber());
def peakBar = if peak then BarNumber() else Double.NaN;
# | find the values of the most recent peak and the one before it
def lastPeakValue = GetValue(high, BarNumber() - HighestAll(peakBar));
def prevPeakValue = GetValue(peakValue[1], BarNumber() - HighestAll(peakBar));
# | find the value of the most recent close
def mostRecentClose = HighestAll(if BarNumber() == lastBar then close else 0);
# | define what is considered to be "in range" of the previous peak
input percent = 0.5;
def inRange = mostRecentClose > (prevPeakValue * (1 - percent / 100)) and mostRecentClose < (prevPeakValue * (1 + percent / 100));
# | extend the most recent peak
plot lastPeakExtension = if BarNumber() >= HighestAll(peakBar) then lastPeakValue else Double.NaN;
lastPeakExtension.SetDefaultColor(Color.light_green);
# | extend the previous peak only if the most recent close value is "in range"
plot prevPeakExtension = if BarNumber() >= HighestAll(peakBar) - 1 then prevPeakValue else Double.NaN;
prevPeakExtension.SetDefaultColor(Color.Dark_Orange);
prevPeakExtension.SetHiding(!inRange);
# | define a valley and plot it
def valley = low < lowest(low[1], magnitude) and low <= lowest(low[-magnitude], magnitude);
def valleyValue = if valley then low else valleyValue[1];
plot valleyLine = valleyValue;
valleyLine.SetPaintingStrategy(PaintingStrategy.HORIZONTAL);
valleyLine.SetDefaultColor(Color.red);
# | get the bar numbers for the most recent close
# | and the most recent valley
def valleyBar = if valley then BarNumber() else Double.NaN;
# | find the values of the most recent peak and the one before it
def lastvalleyValue = GetValue(low, BarNumber() - lowestAll(valleyBar));
def prevvalleyValue = GetValue(valleyValue[1], BarNumber() - lowestAll(valleyBar));
# | define what is considered to be "in range" of the previous peak
def inRange2 = mostRecentClose < (prevValleyValue * (1 - percent / 100)) and mostRecentClose > (prevValleyValue * (1 + percent / 100));
# | extend the most recent peak
plot lastValleyExtension = if BarNumber() <= lowestAll(valleyBar) then lastvalleyValue else Double.NaN;
lastValleyExtension.SetDefaultColor(Color.plum);
# | extend the previous peak only if the most recent close value is "in range"
plot prevValleyExtension = if BarNumber() >= lowestAll(ValleyBar) - 1 then prevValleyValue else Double.NaN;
prevValleyExtension.SetDefaultColor(Color.Dark_Orange);
prevValleyExtension.SetHiding(!inRange2);
plot breakout = if close crosses above peakline then 1 else 0;
breakout.SetPaintingStrategy(PaintingStrategy.BOOLEAN_ARROW_UP);
breakout.SetDefaultColor(Color.Green);
breakout.SetLineWeight(2);
breakout.HideBubble();
plot breakdown = if close crosses below valleyline then 1 else 0;
breakdown.SetPaintingStrategy(PaintingStrategy.BOOLEAN_ARROW_down);
breakdown.SetDefaultColor(Color.red);
breakdown.SetLineWeight(2);
breakdown.HideBubble();
AddCloud(valleyline, valleyline + 0.11, CreateColor(255, 204, 204));
AddCloud(peakline, peakline - 0.11, CreateColor(204, 255, 204));
# | define a peak and plot it
input magnitude = 15;
def peak = high > Highest(high[1], magnitude) and high >= Highest(high[-magnitude], magnitude);
def peakValue = if peak then high else peakValue[1];
def peakLine = peakValue;
# | define a valley and plot it
def valley = low < lowest(low[1], magnitude) and low <= lowest(low[-magnitude], magnitude);
def valleyValue = if valley then low else valleyValue[1];
def valleyLine = valleyValue;
def ShortReversalRange = close crosses above peakline -.10 and (peakline - .10) > (valleyline + 0.10);
def LongReversalRange = close crosses below valleyline +.10 and (peakline - .10) > (valleyline + 0.10);
plot scan = if shortreversalrange or longreversalrange then 1 else 0;
AssignBackgroundColor(if LongReversalRange then Color.DARK_GREEN else if ShortReversalRange then Color.DARK_RED else color.current);
Thread starter | Similar threads | Forum | Replies | Date |
---|---|---|---|---|
F | Need someone help write this code for ThinkorSwim | Questions | 7 | |
T | Please help me set up the Monkey Bars indicator | Questions | 5 | |
E | Panel Indicator Help! | Questions | 2 | |
![]() |
Help with 60/40 percent of candle to show as label | Questions | 6 | |
H | Help with DMI and Hull MA script | Questions | 0 |