Multi-bar Engulfing Pattern

ksle2011

New member
Anyone can help fix the code below by adding Weekly changes? Thank you.


# YTD Return
# Mobius
# 06.15.2015

declare hide_on_intraday;

input price = close;
input length = 1;
input displace = 0;
input Show_Labels = yes;

def newyear = if getYear() != getYear()[1] then 1 else 0;
def newmonth = if getMonth() != getMonth()[1] then 1 else 0;
def yo = compoundValue(1, if newyear then open else yo[1], open);
def mo = compoundValue(1, if newmonth then open else mo[1], open);
def yearopen = yo;
def monthopen = mo;
def SMA = Average(price[-displace], length);
def yochange = (sma - yearopen) / yearopen ;
def mochange = (close - monthopen) / monthopen;

AddLabel(Show_Labels, concat("Year % change = ", AsPercent(yochange)), color.white);
AddLabel(Show_Labels, "Month % change = " + (AsPercent(mochange)), color.white);
 
Solution
@wherdendorf
ouUtOKd.png

Ruby:
def GreenBar = open<=close;
def RedBar = open>close;

def USignal;
If RedBar {
USignal = open;
}else if RedBar[1] and open >= close[1] {
USignal = 0;
}else If USignal[1] and GreenBar and !RedBar[1] and close >= USignal[1] and close[1] < USignal[1]{
USignal = Double.NaN;
}else{
USignal = USignal[1];}

plot line = if IsNaN(Usignal) then USignal[1] else Double.NaN;
line.SetPaintingStrategy(PaintingStrategy.HORIZONTAL);

#AddChartBubble(yes,high,Signal,color.white);
plot UpSignal = if !IsNaN(USignal[1]) and IsNaN(USignal) then USignal[1] else Double.NaN;
UpSignal.SetPaintingStrategy(PaintingStrategy.BOOLEAN_ARROW_UP);
TvrWTRN.png
tjPsnpG.png
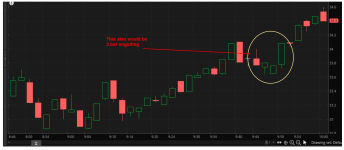
New to ThinkScript. No problem in writing a single bar Engulfing pattern but having trouble with a multi-bar
Engulfing pattern. Could use some help with this one. Could be a 2,3,4,5 bar Engulfing pattern.
 

Attachments

  • TvrWTRN.png
    TvrWTRN.png
    135.3 KB · Views: 300
Last edited by a moderator:
@wherdendorf
ouUtOKd.png

Ruby:
def GreenBar = open<=close;
def RedBar = open>close;

def USignal;
If RedBar {
USignal = open;
}else if RedBar[1] and open >= close[1] {
USignal = 0;
}else If USignal[1] and GreenBar and !RedBar[1] and close >= USignal[1] and close[1] < USignal[1]{
USignal = Double.NaN;
}else{
USignal = USignal[1];}

plot line = if IsNaN(Usignal) then USignal[1] else Double.NaN;
line.SetPaintingStrategy(PaintingStrategy.HORIZONTAL);

#AddChartBubble(yes,high,Signal,color.white);
plot UpSignal = if !IsNaN(USignal[1]) and IsNaN(USignal) then USignal[1] else Double.NaN;
UpSignal.SetPaintingStrategy(PaintingStrategy.BOOLEAN_ARROW_UP);
 
Last edited:
Solution
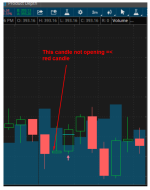
Thank you Svanoy. Was beginning to loose hope for a reply. I have been following you in the algo trading thread with AHK. Someday I to wish to take that journey, but first much to learn. Hope you are doing well. OK back to the script with a few questions. I will put them on the chart.
8GLbFnu.png
ncUG6OL.png
 

Attachments

  • 8GLbFnu.png
    8GLbFnu.png
    73.7 KB · Views: 272
Last edited by a moderator:
Works great. Like to bother you one more time. After backtestinng my strategy I end up with too many signals. I tried myself to edit the script to reflect the 1st green covering bar to open less than the red bar and not = to the red bar close. This simple fix still accomplishes what I am after but with much less signals. I'll be damn if I can see this fix. Too use to just eliminating the = sign in the equation.
 
@wherdendorf In this case, because of the way the logic is written, you actually add an equal sign to the second condition that checks the open of the first green bar against the close of the previous red bar.

Updated the code in my first post to not signal when open of the first green bar is equal to the close of the redbar.
 
ToS has a candlestick pattern wizard that is pretty great and may be helpful in getting this dialed in. Go to your chart > Patterns > Change "Classic" to "candlestick" > Below the list there is button that says "create" and it will take you to a condition wizard. You can create your pattern, name it, and give it a chart signature (ie colored arrow or dot). Once you've created your pattern you can click on "thinkscript editor" and copy the code to use in chart studies as you wish.
 
Anyone can help fix the code below by adding Weekly changes? Thank you.


# YTD Return
# Mobius
# 06.15.2015

declare hide_on_intraday;

input price = close;
input length = 1;
input displace = 0;
input Show_Labels = yes;

def newyear = if getYear() != getYear()[1] then 1 else 0;
def newmonth = if getMonth() != getMonth()[1] then 1 else 0;
def yo = compoundValue(1, if newyear then open else yo[1], open);
def mo = compoundValue(1, if newmonth then open else mo[1], open);
def yearopen = yo;
def monthopen = mo;
def SMA = Average(price[-displace], length);
def yochange = (sma - yearopen) / yearopen ;
def mochange = (close - monthopen) / monthopen;

AddLabel(Show_Labels, concat("Year % change = ", AsPercent(yochange)), color.white);
AddLabel(Show_Labels, "Month % change = " + (AsPercent(mochange)), color.white);

Ruby:
# YTD_Return_1

# YTD Return
# Mobius
# 06.15.2015
declare hide_on_intraday;

input price = close;
input length = 1;
input displace = 0;
input Show_Labels = yes;

def newyear = if getYear() != getYear()[1] then 1 else 0;
def newmonth = if getMonth() != getMonth()[1] then 1 else 0;
def newweek = if getweek() != getweek()[1] then 1 else 0;

def yo = compoundValue(1, if newyear then open else yo[1], open);
def mo = compoundValue(1, if newmonth then open else mo[1], open);
def wo = compoundValue(1, if newweek then open else wo[1], open);

def yearopen = yo;
def monthopen = mo;
def weekopen = wo;

def SMA = Average(price[-displace], length);
def yochange = (sma - yearopen) / yearopen ;
def mochange = (close - monthopen) / monthopen;
def wochange = (close - weekopen) / weekopen;

AddLabel(Show_Labels, concat("Year % change = ", AsPercent(yochange)), color.white);
AddLabel(Show_Labels, "Month % change = " + (AsPercent(mochange)), color.white);
AddLabel(Show_Labels, "Week % change = " + (AsPercent(wochange)), color.white);
#
 
ToS has a candlestick pattern wizard that is pretty great and may be helpful in getting this dialed in. Go to your chart > Patterns > Change "Classic" to "candlestick" > Below the list there is button that says "create" and it will take you to a condition wizard. You can create your pattern, name it, and give it a chart signature (ie colored arrow or dot). Once you've created your pattern you can click on "thinkscript editor" and copy the code to use in chart studies as you wish.
THANKS...I will check it out,
 
Seeing as I waited for my answer In the Questions forum I figured I would go to you for this. Being as I am backtesting this engulfing model I find it pretty much totally useless as far as P&L, when thinkscript only adds orders on the next bar. In your algo trading with ahk is this problem solved? I do realize that entry and exit on the signal intrabar would lead to some false signals but through my testing the benefits far out way the negatives especially on the larger time frames.
 
@eddiehaskel
You could change this line:
Ruby:
}else If USignal[1] and GreenBar and !RedBar[1] and close >= USignal[1] and close[1] < USignal[1]{
to use 'high' instead of 'close':
Ruby:
}else If USignal[1] and GreenBar and !RedBar[1] and high >= USignal[1] and high[1] < USignal[1]{

Personally I only use studies that buy or sell after the previous bar signal.
So then I guess my thoughts were correct in assuming in thinkscript if you add order it will only fill on the the open of the next bar. From what I have been reading too you can not use a arrow or the horizontal line to enter a trade.
 
So then I guess my thoughts were correct in assuming in thinkscript if you add order it will only fill on the the open of the next bar.
Technically, you can code your add order anywhere. You can wait until a trend ends and then go back in time and plot perfect add orders, arrows, horizontal lines 1 bars back, 5 bars back, 100 bars back.

The default is filling on the open of the next bar after a signal because that is when a trade can be realistically filled.
We request that a strategy use the default when posted to the forum so our 50k viewers are not given false perceptions..

From what I have been reading too you can not use a arrow or the horizontal line to enter a trade.
Conditional orders can be written to enter a trade based on the logic of the arrow / horizontal line.
Conditional orders are single orders against a specific stock that execute once and then are done.
This particular indicator looks back at the prior bar and conditional orders execute on the current. That type of logic might be problematic in a conditional order; so not sure if / how the order will be filled.

If you create a conditional order, come back and let us know how it goes.

The ToS platform does not support auto-trading.
 
If possible would like it in the AddOrder(OrderType.BUY_AUTO,SELL_AUTO config as to enter within the current candle and not the open of the next. Here is the code:
The arrow and horizontal line are formed at the same time.

Seeing as this is a trend strategy this type of config should reverse positions, as I have read.
 
If possible would like it in the AddOrder(OrderType.BUY_AUTO,SELL_AUTO config as to enter within the current candle and not the open of the next. Here is the code:
The arrow and horizontal line are formed at the same time.
Seeing as this is a trend strategy this type of config should reverse positions, as I have read.

hello,
why are you posting partial code , and as an image ? is it top secret?
as an image, no one can copy it and debug it and tweak it.
if it is incomplete, so no one can debug it and tweak it.

please post complete study code text, in a code window.
post 7 , how to post code in a code window
https://usethinkscript.com/threads/answers-to-commonly-asked-questions.6006/#post-58016


asking for something to happen when an arrow appears is not the correct way.
disregard if you aren't familiar with thinkscript yet.

objects are drawn when a desired condition occurs. usually a variable is set to a condition and that variable is used in a plot formula.
we need to figure out what variable/formula is triggering the arrow, then use it in the addorder.

( this is how i understand it, someone correct me if i am wrong)
addorders by default, reference a future open price, a price that is not changing.
price open[-1] Defines price at which the order is added.
but if you use high, low, or close, or some variable value from the current candle, those values could change multiple times during the time period of the candle, and possibly cause multiple orders.
https://tlc.thinkorswim.com/center/reference/thinkScript/Functions/Others/AddOrder
 
Thanks for the reply. I guess I am just so use to taking screenshots. Anyways, that is the whole long code.
As simple as it gets. The only reason I asked the question was for the feedback as to addorders. No code correction needed.
I only have problem writing the proper Syntext for the addorder because there is no combination of buy_auto and sell_auto
in the same string in the tutorial docs. What I have read in posts is that placing buy or sell orders in auto will result in a current candle fill . While buy or sell to close will default to open on next candle. Also this buy/sell auto together would create a reversal of position. I do understand your concern of multiple orders within one bar but with global strategy setting at max 1 contract this will not be a problem. The script is calling for a arrow and a horizontal line to be placed as soon as the engulfing pattern is completed. Do you think this is possible would be my question.

i think you will need 2 addorders, one for buying and one for selling.

i typed in your code and tried the arrow formula as a buy signal
i started with price at open[-1], then changed it to close[0]. both seemed to work.

you didn't mention a sell signal, so i just made up one for testing.

Code:
# strat_upsignal_chg_to_strategy_0

def greenbar = open <= close;
def redbar = open > close;
def usignal;
if redbar {
    usignal = open;
} else if redbar[1] and open >= close[1] {
    usignal = 0;
} else if usignal[1] and greenbar and !redbar[0] and close >= usignal[1] and close[1] < usignal[1] {
    usignal = Double.NaN;
} else {
    usignal = usignal[1];
}
plot line = if isnan(usignal) then usignal[1] else double.nan;
line.setpaintingstrategy(paintingstrategy.horizontal);
#addchartbubble(yes,high,signal,color.white,yes);

plot upsignal = if !isnan(usignal[1]) and isnan(usignal) then usignal[1] else double.nan;
upsignal.setpaintingstrategy(paintingstrategy.boolean_arrow_up);
upsignal.setdefaultcolor(color.white);
#

# use same formula as arrow formula
def buy1 = if !isnan(usignal[1]) and isnan(usignal) then 1 else 0;
#def buyprice = open[-1];
def buyprice = close[0];

def sell1 = buy1[11];

addorder(OrderType.BUY_AUTO, buy1, buyprice, 1, color.yellow, color.green, "buy");
addorder(OrderType.sell_AUTO, sell1, buyprice, 1, color.yellow, color.red, "sell");

# ----------------------------

input test1_bubble = no;
addchartbubble(test1_bubble, low*0.99,
greenbar + "\n" +
redbar + "\n" +
usignal
, color.cyan, no);
#
#
 

Join useThinkScript to post your question to a community of 21,000+ developers and traders.

Similar threads

Not the exact question you're looking for?

Start a new thread and receive assistance from our community.

87k+ Posts
446 Online
Create Post

Similar threads

Similar threads

The Market Trading Game Changer

Join 2,500+ subscribers inside the useThinkScript VIP Membership Club
  • Exclusive indicators
  • Proven strategies & setups
  • Private Discord community
  • ‘Buy The Dip’ signal alerts
  • Exclusive members-only content
  • Add-ons and resources
  • 1 full year of unlimited support

Frequently Asked Questions

What is useThinkScript?

useThinkScript is the #1 community of stock market investors using indicators and other tools to power their trading strategies. Traders of all skill levels use our forums to learn about scripting and indicators, help each other, and discover new ways to gain an edge in the markets.

How do I get started?

We get it. Our forum can be intimidating, if not overwhelming. With thousands of topics, tens of thousands of posts, our community has created an incredibly deep knowledge base for stock traders. No one can ever exhaust every resource provided on our site.

If you are new, or just looking for guidance, here are some helpful links to get you started.

What are the benefits of VIP Membership?
VIP members get exclusive access to these proven and tested premium indicators: Buy the Dip, Advanced Market Moves 2.0, Take Profit, and Volatility Trading Range. In addition, VIP members get access to over 50 VIP-only custom indicators, add-ons, and strategies, private VIP-only forums, private Discord channel to discuss trades and strategies in real-time, customer support, trade alerts, and much more. Learn all about VIP membership here.
How can I access the premium indicators?
To access the premium indicators, which are plug and play ready, sign up for VIP membership here.
Back
Top