# TS_TapeMomentum
# http://www.thinkscripter.com
# [email protected]
# Last Update 07 Nov 2010
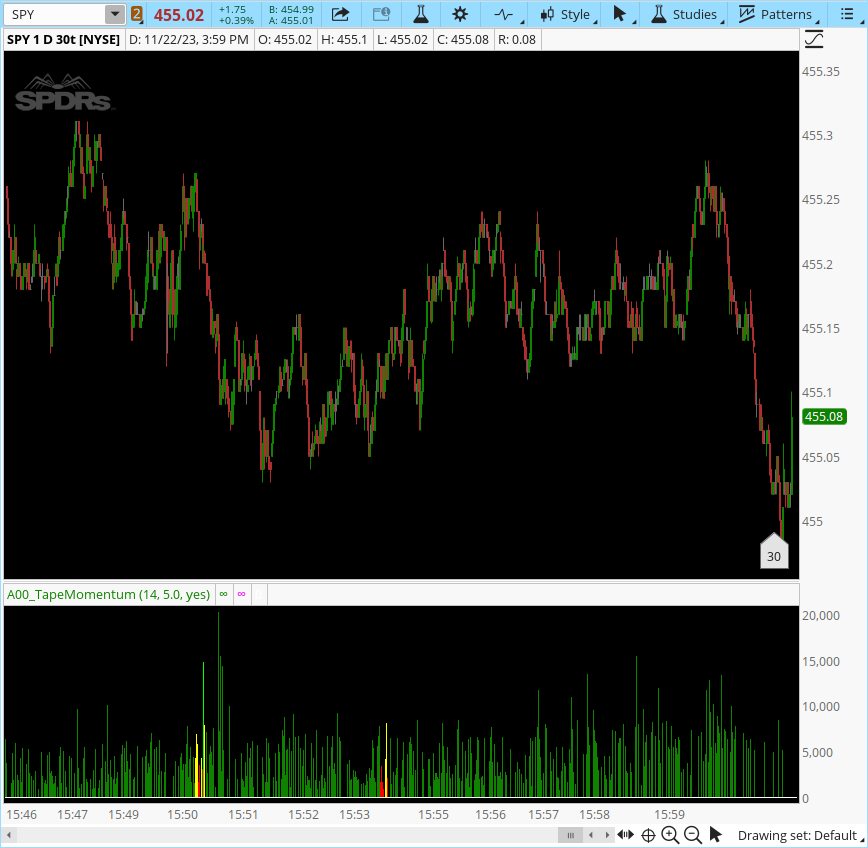
#hint: For use on tick charts <b>ONLY</b>. Red inidcates average momentum, yellow > average, green > two standard deviations.
#hint period: Averaging period.
#hint capMultiplier: Multiple of standard deviation at which large spikes will be truncated with a magenta dot.
#hint capLargeSpikes: Truncate larger spikes at a given standard deviation multiplier to avoid scale compression.
declare lower;
input period = 14;
input capMultiplier = 5.0;
input capLargeSpikes = YES;
def isTickChart = if getAggregationPeriod() <= 3200 then 1 else 0;
def timer = secondsTillTime(1615);
def deltaT = absValue(timer[-1]-timer);
def momentum = if isTickChart then volume/deltaT else 0;;
def aveSM = average(momentum,period);
def sdAve = aveSM+2*stdev(momentum, period);
def spikeCap = totalSum(momentum)/barNumber()*capMultiplier;
plot tickMomentum = if capLargeSpikes then min(momentum, spikeCap) else momentum;
plot cap = if capLargeSpikes and tickMomentum==spikeCap then spikeCap else double.nan;
cap.setStyle(curve.POINTS);
cap.setLineWeight(2);
cap.setDefaultColor(color.magenta);
tickMomentum.setPaintingStrategy(paintingStrategy.HISTOGRAM);
tickMomentum.setLineWeight(2);
tickMomentum.assignValueColor(if tickMomentum >=min(spikeCap, sdAve) then color.green else if tickMomentum > aveSM then color.yellow else color.red);
plot zero = 0;
zero.setDefaultColor(color.white);
addChartLabel(!isTickChart,"THIS STUDY ONLY FOR USE ON TICK CHARTS",color.red);