How to Compare Stock Charts in ThinkorSwim

JADragon3

New member
Multi Symbol Comparison as a lower study. You can get pretty creative with it. Add composite symbols to track indexes for better visualization.
Code:
declare lower;

#hint showKey: OFF hides the symbol key, NUM numbers the symbol text, TXT shows just the symbol text.
input showKey = {OFF, NUM, default TXT};
#hint price: Changes the fundamental price type.
input price = FundamentalType.CLOSE;
#The following symbols may be changed to your preference but none should be blank. You may turn off any of these via the 'input use? = ' function. Each symbol is implied-numbered from 1 to 10, top-to-bottom sequentially.
input symbol1 = "SPY";
input symbol2 = "QQQ";
input symbol3 = "IWM";
input symbol4 = "DIA";
input symbol5 = "AAPL";
input symbol6 = "FCX";
input symbol7 = "GOOG";
input symbol8 = "IBM";
input symbol9 = "JPM";
input symbol10 = "XOM";

#hint use1: use1 to use10 toggle display of their respective symbol.
input use1 = Yes;
input use2 = Yes;
input use3 = Yes;
input use4 = Yes;
input use5 = Yes;
input use6 = Yes;
input use7 = Yes;
input use8 = Yes;
input use9 = Yes;
input use10 = Yes;
# changing the Min and Max values will determine the minimum and maximum plotted values for all symbols.

script normalize {
    input data = close;
    input Min = -10000;
    input Max = 10000;

    def ha = HighestAll( data );
    def la = LowestAll( data );
    plot normalize = (((Max - Min) * (data - la)) / (ha - la)) + Min;
}

def s1 = if use1 then Fundamental(price, symbol1) else Double.NaN;
def s2 = if use2 then Fundamental(price, symbol2) else Double.NaN;
def s3 = if use3 then Fundamental(price, symbol3) else Double.NaN;
def s4 = if use4 then Fundamental(price, symbol4) else Double.NaN;
def s5 = if use5 then Fundamental(price, symbol5) else Double.NaN;
def s6 = if use6 then Fundamental(price, symbol6) else Double.NaN;
def s7 = if use7 then Fundamental(price, symbol7) else Double.NaN;
def s8 = if use8 then Fundamental(price, symbol8) else Double.NaN;
def s9 = if use9 then Fundamental(price, symbol9) else Double.NaN;
def s10 = if use10 then Fundamental(price, symbol10) else Double.NaN;

def r1 = CompoundValue(1, if !IsNaN(s1) then normalize(s1) else r1[1], Double.NaN);
def r2 = CompoundValue(1, if !IsNaN(s2) then normalize(s2) else r2[1], Double.NaN);
def r3 = CompoundValue(1, if !IsNaN(s3) then normalize(s3) else r3[1], Double.NaN);
def r4 = CompoundValue(1, if !IsNaN(s4) then normalize(s4) else r4[1], Double.NaN);
def r5 = CompoundValue(1, if !IsNaN(s5) then normalize(s5) else r5[1], Double.NaN);
def r6 = CompoundValue(1, if !IsNaN(s6) then normalize(s6) else r6[1], Double.NaN);
def r7 = CompoundValue(1, if !IsNaN(s7) then normalize(s7) else r7[1], Double.NaN);
def r8 = CompoundValue(1, if !IsNaN(s8) then normalize(s8) else r8[1], Double.NaN);
def r9 = CompoundValue(1, if !IsNaN(s9) then normalize(s9) else r9[1], Double.NaN);
def r10 = CompoundValue(1, if !IsNaN(s10) then normalize(s10) else r10[1], Double.NaN);

# States: 0 = Not initialized, 1 = Initialized.
def st = {default "0", "1"};
# Offsets:
def ofst1;
def ofst2;
def ofst3;
def ofst4;
def ofst5;
def ofst6;
def ofst7;
def ofst8;
def ofst9;
def ofst10;

if st[1] == st."0" {
    if (!use1 or !IsNaN(r1)) and (!use2 or !IsNaN(r2))
  and (!use3 or !IsNaN(r3)) and (!use4 or !IsNaN(r4))
  and (!use5 or !IsNaN(r5)) and (!use6 or !IsNaN(r6))
  and (!use7 or !IsNaN(r7)) and (!use8 or !IsNaN(r8))
  and (!use9 or !IsNaN(r9)) and (!use10 or !IsNaN(r10))
    {
        ofst1 = r1;
        ofst2 = r2;
        ofst3 = r3;
        ofst4 = r4;
        ofst5 = r5;
        ofst6 = r6;
        ofst7 = r7;
        ofst8 = r8;
        ofst9 = r9;
        ofst10 = r10;
        st = st."1";
    } else {
    # Not initialized.
        ofst1 = Double.NaN;
        ofst2 = Double.NaN;
        ofst3 = Double.NaN;
        ofst4 = Double.NaN;
        ofst5 = Double.NaN;
        ofst6 = Double.NaN;
        ofst7 = Double.NaN;
        ofst8 = Double.NaN;
        ofst9 = Double.NaN;
        ofst10 = Double.NaN;
        st = st[1];
    }
} else {
    ofst1 = ofst1[1];
    ofst2 = ofst2[1];
    ofst3 = ofst3[1];
    ofst4 = ofst4[1];
    ofst5 = ofst5[1];
    ofst6 = ofst6[1];
    ofst7 = ofst7[1];
    ofst8 = ofst8[1];
    ofst9 = ofst9[1];
    ofst10 = ofst10[1];
    st = st[1];
}

def ok = !IsNaN(close) and st == st."1";
plot p1 = if ok then r1 - ofst1 else Double.NaN;
plot p2 = if ok then r2 - ofst2 else Double.NaN;
plot p3 = if ok then r3 - ofst3 else Double.NaN;
plot p4 = if ok then r4 - ofst4 else Double.NaN;
plot p5 = if ok then r5 - ofst5 else Double.NaN;
plot p6 = if ok then r6 - ofst6 else Double.NaN;
plot p7 = if ok then r7 - ofst7 else Double.NaN;
plot p8 = if ok then r8 - ofst8 else Double.NaN;
plot p9 = if ok then r9 - ofst9 else Double.NaN;
plot p10 = if ok then r10 - ofst10 else Double.NaN;

plot Zero = 0;
Zero.SetDefaultColor(Color.GRAY);

def n = showKey == showKey.NUM;

AddLabel(showKey and use1, (if n then "1. " else "") + symbol1, p1.TakeValueColor());
AddLabel(showKey and use2, (if n then "2. " else "") + symbol2, p2.TakeValueColor());
AddLabel(showKey and use3, (if n then "3. " else "") + symbol3, p3.TakeValueColor());
AddLabel(showKey and use4, (if n then "4. " else "") + symbol4, p4.TakeValueColor());
AddLabel(showKey and use5, (if n then "5. " else "") + symbol5, p5.TakeValueColor());
AddLabel(showKey and use6, (if n then "6. " else "") + symbol6, p6.TakeValueColor());
AddLabel(showKey and use7, (if n then "7. " else "") + symbol7, p7.TakeValueColor());
AddLabel(showKey and use8, (if n then "8. " else "") + symbol8, p8.TakeValueColor());
AddLabel(showKey and use9, (if n then "9. " else "") + symbol9, p9.TakeValueColor());
AddLabel(showKey and use10, (if n then "10. " else "") + symbol10, p10.TakeValueColor());
# end
 

Join useThinkScript to post your question to a community of 21,000+ developers and traders.

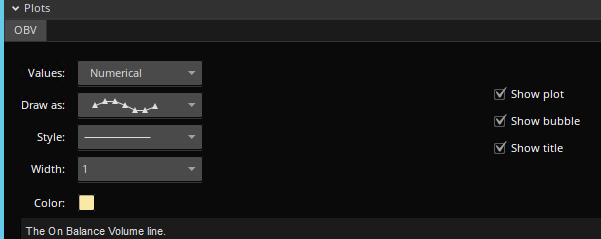
Hi - can anyone create the comparison line indicator with the plotting styles similar to standard lower pane indicators? Below is an example for OBV

B06cth.jpg


Thx
Lance
 
@lance Try this script:

Code:
declare lower;

plot Data = close("SPX");

Make sure to change SPX to the ticker symbol of your choosing.
 
@lance Are you aware that there is a standard TOS Study named Comparison that can be used independently of other Studies/Strategies...??? The benefit of this Study is that it can be set to allow for better scaling between multiple prices... 💡
 
@lance Thanks - would like it to plot on the main window - also i noticed when using the code the symbol list doesn't automatically populate as i type - does that matter?
 
Here is a quick starter example for you... Ok, now it's done... Pretty much self-explanatory... I added the Comparison Study, dragged it down with the MA's, and adjusted the settings... Done...!!! I now have an entire added Chart Study without cluttering up the Upper Panel...

A3Vuj6P.jpg


JJxjTiN.jpg


SBNB9tG.jpg


ScKEdRc.jpg
 
Last edited:
Like to see if there is a way to make a scanner for stock crossovers much like an EMA crossover but instead it simply be another ticker like /ES SPX SQQQ and so on. Closest I found was a comparison under study but only has how many bars options and no ticker or anything else to input, image below. Can someone help or is this impossible? Seems easy enough but I haven't seen anything.
Thanks
iubixDc.png
 
Like to see if there is a way to make a scanner for stock crossovers much like an EMA crossover but instead it simply be another ticker like /ES SPX SQQQ and so on. Closest I found was a comparison under study but only has how many bars options and no ticker or anything else to input, image below. Can someone help or is this impossible? Seems easy enough but I haven't seen anything.

I don't see a way to do it using Comparison, though that would have been simplest. By default it uses SPX. Unfortunately, in the condition editor it doesn't show any plots which could be used with crosses above or crosses below. I tried doing it in code and it won't save.

Getting the price from another symbol is working in the scan.

Aside from that it gets really tricky. You need a way to normalize the two prices for comparison. SPX is 3900 and NIO is 55 so you can't compare them directly. Percentage movement won't work since a low price stock moves in percentages much easier/faster than high priced. I have normalization code that words for comparing other things but it uses a range from low to high. Your comparison would need to be anchored to the opening prices. I think it's possible but more complex of a problem than I want to put my time into right now.

If I was going to work on it the first thing I would try is something along the lines of taking this normalization code and making it so the opening price for each stock, in the normalized range, is zero. If you can get that to happen then you'll have everything you need.

Ruby:
script normalizePlot {
  input data = close;
  input newRngMin = -1;
  input newRngMax = 1;

  def HHData = HighestAll( data );
  def LLData = LowestAll( data );
  plot nr = ((( newRngMax - newRngMin ) * ( data - LLData )) / ( HHData - LLData )) + newRngMin;
}
 
Last edited:
Multi Symbol Comparison as a lower study. You can get pretty creative with it. Add composite symbols to track indexes for better visualization.
Code:
declare lower;

#hint showKey: OFF hides the symbol key, NUM numbers the symbol text, TXT shows just the symbol text.
input showKey = {OFF, NUM, default TXT};
#hint price: Changes the fundamental price type.
input price = FundamentalType.CLOSE;
#The following symbols may be changed to your preference but none should be blank. You may turn off any of these via the 'input use? = ' function. Each symbol is implied-numbered from 1 to 10, top-to-bottom sequentially.
input symbol1 = "SPY";
input symbol2 = "QQQ";
input symbol3 = "IWM";
input symbol4 = "DIA";
input symbol5 = "AAPL";
input symbol6 = "FCX";
input symbol7 = "GOOG";
input symbol8 = "IBM";
input symbol9 = "JPM";
input symbol10 = "XOM";

#hint use1: use1 to use10 toggle display of their respective symbol.
input use1 = Yes;
input use2 = Yes;
input use3 = Yes;
input use4 = Yes;
input use5 = Yes;
input use6 = Yes;
input use7 = Yes;
input use8 = Yes;
input use9 = Yes;
input use10 = Yes;
# changing the Min and Max values will determine the minimum and maximum plotted values for all symbols.

script normalize {
    input data = close;
    input Min = -10000;
    input Max = 10000;

    def ha = HighestAll( data );
    def la = LowestAll( data );
    plot normalize = (((Max - Min) * (data - la)) / (ha - la)) + Min;
}

def s1 = if use1 then Fundamental(price, symbol1) else Double.NaN;
def s2 = if use2 then Fundamental(price, symbol2) else Double.NaN;
def s3 = if use3 then Fundamental(price, symbol3) else Double.NaN;
def s4 = if use4 then Fundamental(price, symbol4) else Double.NaN;
def s5 = if use5 then Fundamental(price, symbol5) else Double.NaN;
def s6 = if use6 then Fundamental(price, symbol6) else Double.NaN;
def s7 = if use7 then Fundamental(price, symbol7) else Double.NaN;
def s8 = if use8 then Fundamental(price, symbol8) else Double.NaN;
def s9 = if use9 then Fundamental(price, symbol9) else Double.NaN;
def s10 = if use10 then Fundamental(price, symbol10) else Double.NaN;

def r1 = CompoundValue(1, if !IsNaN(s1) then normalize(s1) else r1[1], Double.NaN);
def r2 = CompoundValue(1, if !IsNaN(s2) then normalize(s2) else r2[1], Double.NaN);
def r3 = CompoundValue(1, if !IsNaN(s3) then normalize(s3) else r3[1], Double.NaN);
def r4 = CompoundValue(1, if !IsNaN(s4) then normalize(s4) else r4[1], Double.NaN);
def r5 = CompoundValue(1, if !IsNaN(s5) then normalize(s5) else r5[1], Double.NaN);
def r6 = CompoundValue(1, if !IsNaN(s6) then normalize(s6) else r6[1], Double.NaN);
def r7 = CompoundValue(1, if !IsNaN(s7) then normalize(s7) else r7[1], Double.NaN);
def r8 = CompoundValue(1, if !IsNaN(s8) then normalize(s8) else r8[1], Double.NaN);
def r9 = CompoundValue(1, if !IsNaN(s9) then normalize(s9) else r9[1], Double.NaN);
def r10 = CompoundValue(1, if !IsNaN(s10) then normalize(s10) else r10[1], Double.NaN);

# States: 0 = Not initialized, 1 = Initialized.
def st = {default "0", "1"};
# Offsets:
def ofst1;
def ofst2;
def ofst3;
def ofst4;
def ofst5;
def ofst6;
def ofst7;
def ofst8;
def ofst9;
def ofst10;

if st[1] == st."0" {
    if (!use1 or !IsNaN(r1)) and (!use2 or !IsNaN(r2))
  and (!use3 or !IsNaN(r3)) and (!use4 or !IsNaN(r4))
  and (!use5 or !IsNaN(r5)) and (!use6 or !IsNaN(r6))
  and (!use7 or !IsNaN(r7)) and (!use8 or !IsNaN(r8))
  and (!use9 or !IsNaN(r9)) and (!use10 or !IsNaN(r10))
    {
        ofst1 = r1;
        ofst2 = r2;
        ofst3 = r3;
        ofst4 = r4;
        ofst5 = r5;
        ofst6 = r6;
        ofst7 = r7;
        ofst8 = r8;
        ofst9 = r9;
        ofst10 = r10;
        st = st."1";
    } else {
    # Not initialized.
        ofst1 = Double.NaN;
        ofst2 = Double.NaN;
        ofst3 = Double.NaN;
        ofst4 = Double.NaN;
        ofst5 = Double.NaN;
        ofst6 = Double.NaN;
        ofst7 = Double.NaN;
        ofst8 = Double.NaN;
        ofst9 = Double.NaN;
        ofst10 = Double.NaN;
        st = st[1];
    }
} else {
    ofst1 = ofst1[1];
    ofst2 = ofst2[1];
    ofst3 = ofst3[1];
    ofst4 = ofst4[1];
    ofst5 = ofst5[1];
    ofst6 = ofst6[1];
    ofst7 = ofst7[1];
    ofst8 = ofst8[1];
    ofst9 = ofst9[1];
    ofst10 = ofst10[1];
    st = st[1];
}

def ok = !IsNaN(close) and st == st."1";
plot p1 = if ok then r1 - ofst1 else Double.NaN;
plot p2 = if ok then r2 - ofst2 else Double.NaN;
plot p3 = if ok then r3 - ofst3 else Double.NaN;
plot p4 = if ok then r4 - ofst4 else Double.NaN;
plot p5 = if ok then r5 - ofst5 else Double.NaN;
plot p6 = if ok then r6 - ofst6 else Double.NaN;
plot p7 = if ok then r7 - ofst7 else Double.NaN;
plot p8 = if ok then r8 - ofst8 else Double.NaN;
plot p9 = if ok then r9 - ofst9 else Double.NaN;
plot p10 = if ok then r10 - ofst10 else Double.NaN;

plot Zero = 0;
Zero.SetDefaultColor(Color.GRAY);

def n = showKey == showKey.NUM;

AddLabel(showKey and use1, (if n then "1. " else "") + symbol1, p1.TakeValueColor());
AddLabel(showKey and use2, (if n then "2. " else "") + symbol2, p2.TakeValueColor());
AddLabel(showKey and use3, (if n then "3. " else "") + symbol3, p3.TakeValueColor());
AddLabel(showKey and use4, (if n then "4. " else "") + symbol4, p4.TakeValueColor());
AddLabel(showKey and use5, (if n then "5. " else "") + symbol5, p5.TakeValueColor());
AddLabel(showKey and use6, (if n then "6. " else "") + symbol6, p6.TakeValueColor());
AddLabel(showKey and use7, (if n then "7. " else "") + symbol7, p7.TakeValueColor());
AddLabel(showKey and use8, (if n then "8. " else "") + symbol8, p8.TakeValueColor());
AddLabel(showKey and use9, (if n then "9. " else "") + symbol9, p9.TakeValueColor());
AddLabel(showKey and use10, (if n then "10. " else "") + symbol10, p10.TakeValueColor());
# end
I just used this script to create a study showing 11 Sector Spdr ETF's in comparison. The Comparison Study in TOS doesn't line up on the starting point. This does. Went through and changed everything to show 12 items (including SPY). Beautiful. Would like to hover over each and see label since some of the colors are pretty close to each other. Anyone wanna guide me through that?
 
I just used this script to create a study showing 11 Sector Spdr ETF's in comparison. The Comparison Study in TOS doesn't line up on the starting point. This does. Went through and changed everything to show 12 items (including SPY). Beautiful. Would like to hover over each and see label since some of the colors are pretty close to each other. Anyone wanna guide me through that?

You won't be able to get a label on hover but you can use AddChartBubble to label each of the lines. If some of the lines are close together causing the chart bubbles to overlap you can offset the position on some of them to prevent that.
 

Similar threads

Not the exact question you're looking for?

Start a new thread and receive assistance from our community.

87k+ Posts
454 Online
Create Post

Similar threads

Similar threads

The Market Trading Game Changer

Join 2,500+ subscribers inside the useThinkScript VIP Membership Club
  • Exclusive indicators
  • Proven strategies & setups
  • Private Discord community
  • ‘Buy The Dip’ signal alerts
  • Exclusive members-only content
  • Add-ons and resources
  • 1 full year of unlimited support

Frequently Asked Questions

What is useThinkScript?

useThinkScript is the #1 community of stock market investors using indicators and other tools to power their trading strategies. Traders of all skill levels use our forums to learn about scripting and indicators, help each other, and discover new ways to gain an edge in the markets.

How do I get started?

We get it. Our forum can be intimidating, if not overwhelming. With thousands of topics, tens of thousands of posts, our community has created an incredibly deep knowledge base for stock traders. No one can ever exhaust every resource provided on our site.

If you are new, or just looking for guidance, here are some helpful links to get you started.

What are the benefits of VIP Membership?
VIP members get exclusive access to these proven and tested premium indicators: Buy the Dip, Advanced Market Moves 2.0, Take Profit, and Volatility Trading Range. In addition, VIP members get access to over 50 VIP-only custom indicators, add-ons, and strategies, private VIP-only forums, private Discord channel to discuss trades and strategies in real-time, customer support, trade alerts, and much more. Learn all about VIP membership here.
How can I access the premium indicators?
To access the premium indicators, which are plug and play ready, sign up for VIP membership here.
Back
Top