MP432
Member
Hello all,
SMT divergence is a term coined by the trader known as ICT.
He compares the price action of ES and NQ primarily and notes if one symbol is making a higher high or lower low and the other is not.
Can someone help me code a divergence indicator?
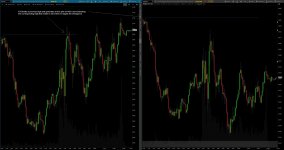
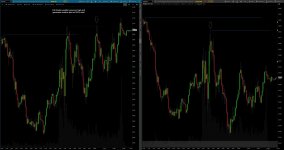
My initial thought is two have two charts open, side by side:
-When BOTH symbols are making new highs or lows to any of the (X) amount of bars before the current bar, nothing is plotted.
__
-When [S1] (Symbol 1 - ES) is making a new high/low and [S2] (Symbol 2 - NQ) is not, I would like a horizontal plot on S2's high or low corresponding to the high or low and bar number of S1.
-Inversely, When S2 makes a HH or LL and S1 does not, I would like a horizontal plot from the corresponding bar number and High or low on S1.
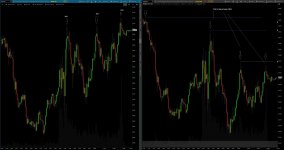
This will show us that a high or low needs to be broken in order for a divergence to be avoided. If the plot appears and price does not cross the high or low and effectively remove the plot, then a divergence has occurred and liquidity may have been taken by one or the other for an upcoming move.
These divergences happen very often and so it is somewhat difficult to narrow in which ones are significant. I expect a cluttered chart and so some way of mitigating the noise would be ideal. ____
Here is a drawn example of a divergence plotted.

SMT divergence is a term coined by the trader known as ICT.
He compares the price action of ES and NQ primarily and notes if one symbol is making a higher high or lower low and the other is not.
Can someone help me code a divergence indicator?
My initial thought is two have two charts open, side by side:
-When BOTH symbols are making new highs or lows to any of the (X) amount of bars before the current bar, nothing is plotted.
__
-When [S1] (Symbol 1 - ES) is making a new high/low and [S2] (Symbol 2 - NQ) is not, I would like a horizontal plot on S2's high or low corresponding to the high or low and bar number of S1.
-Inversely, When S2 makes a HH or LL and S1 does not, I would like a horizontal plot from the corresponding bar number and High or low on S1.
This will show us that a high or low needs to be broken in order for a divergence to be avoided. If the plot appears and price does not cross the high or low and effectively remove the plot, then a divergence has occurred and liquidity may have been taken by one or the other for an upcoming move.
These divergences happen very often and so it is somewhat difficult to narrow in which ones are significant. I expect a cluttered chart and so some way of mitigating the noise would be ideal. ____
Here is a drawn example of a divergence plotted.
Last edited: