Heiken-Ashi Moving Average (HAMA) for ThinkorSwim

Hi Ben,

I don't know if you want to check into this but I just spoke with a tech sup in TOS David Walsh. I explained the situation as far as should the "START AGGREGATION AT MARKET OPEN" (under settings and equities) be checked or unchecked. I explained what Pete Hahn posted on his site that to have it unchecked because it will affect your intraday charts and that you had said it was personal preference. He said that yes it is set to default, but only keep it checked if you are a long term trader. If you are a short term trader or a swing trader keep it Unhacked because it takes into effect daily averages for example volume or VWAP and if you leave that box checked it will indeed effect the intraday charts to other functions of the TOS platform, but again it does not really effect long term charts...

I didn't know if it was a big deal...

Thanks and sorry to bother.

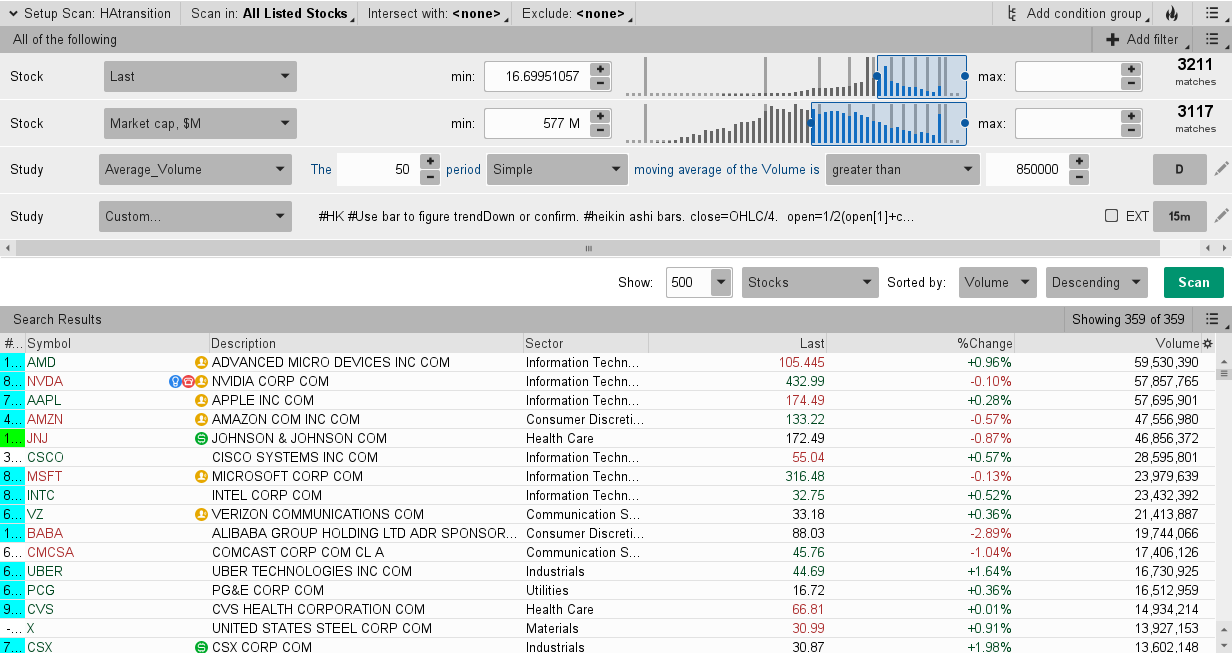
@skynetgen Hi I set everything up and have the sizzle index in the watchlist...when I hit to sort the highest I get is about a 3.1 on the sizzle index. I tried changing parameters with the scan itself and added sizzle in there also but same results....is there a way that you can adjust the sizzle to look for greater than 5 or is it predetermined and today the highest sizzle would only be a 3.1? thanks appreciate your help
 
Last edited:

Join useThinkScript to post your question to a community of 21,000+ developers and traders.

Hey guys....Could some one help fine tune my script.....Trying to get all the dots like the top pic...All aligned....My script is the lower one....Any help would be help...

Code:
declare lower;
def haClose = ohlc4;
def haOpen = if haOpen[1] == 0 then haClose[1] else (haOpen[1] + haClose[1]) / 2;
def haHigh = Max(high, Max(haClose, haOpen));
def haLow = Min(low, Min(haClose, haOpen));
plot firstGreen = if haClose > haOpen and haClose[1] <= haOpen[1] then 0.5 else 0;
firstGreen.SetPaintingStrategy(PaintingStrategy.HISTOGRAM);
firstGreen.SetDefaultColor(Color.YELLOW);
plot firstRed = if haClose < haOpen and haClose[1] >= haOpen[1] then -0.5 else 0;
firstRed.SetPaintingStrategy(PaintingStrategy.HISTOGRAM);
firstRed.SetDefaultColor(Color.YELLOW);
plot trendUp = if !firstGreen and haClose > haOpen then 1 else 0;
trendUp.SetDefaultColor(Color.GREEN);
trendUp.SetPaintingStrategy(PaintingStrategy.HISTOGRAM);
plot trendDown = if !firstRed and haClose < haOpen then -1 else 0;
trendDown.SetDefaultColor(Color.RED);
trendDown.SetPaintingStrategy(PaintingStrategy.HISTOGRAM);


Would it be possible to add HeikenAshi my supertrend cci aatr combo version

Code:
# ST_SuperTrend_CCI_ATR_Combo
# Mobius...originator of CCI_ATR and SuperTrend
# original Chat room request 01.28.2016
# with some modification from Syracuse Pro
# Combo modification created by Ghost and Hguru
# 02/03/2019
# Hguru--- I use this as a stop area(look at the cloud)with the SuperTrend line crossing and staying above CCI ATR line for short and SuperTrend line crossing and staying below CCI ATR line for long. After the crossover look for an entry after 2nd candle. Watch for the Trend as well based on the crossover and the cloud coloring.
#This started out as I was using the 2 separate studies and I then mashed them together and then Street helped turn this into a very usable study. The settings work best for me but if any one finds better ones please share those.
#This works on all charts
#check and un-check the toggle options to create your own look of this study.
#There are multiple candle coloring options. The Picture below is using the ComboPriceColor
input showpositionbubble = yes;
input showentrybubble = yes;
input entryarrows = yes;
input STpricecolor = no;
input combopricecolor = yes;
input CCIATRPriceColor = no;
input alerts = no;
input showlocationbubble = yes;
input Factor = 1.3;
input Pd = 60;
input Lookback = 3;
input usecloud = yes;
input vertLine = yes;
input lengthCCI = 20;
input lengthATR = 4;
input AtrFactor = 0.7;
Def pricedata = HL2[lookback];
DefineGlobalColor("TrendUp", CreateColor(0, 255, 255));
DefineGlobalColor("TrendDown", CreateColor(0, 102, 255));
def Up = pricedata - (Factor * ATR(Pd));
def Dn = pricedata + (Factor * ATR(Pd));
def TrendUp = if close[1] > TrendUp[1] then Max(Up, TrendUp[1]) else Up;
def TrendDown = if close[1] < TrendDown[1] then Min(Dn, TrendDown[1]) else Dn;
def Trend = if close > TrendDown[1] then 1 else if close < TrendUp[1] then -1 else (Trend[1]);
plot Tsl = if Trend == 1 then TrendUp else TrendDown;
Tsl.AssignValueColor(if Trend == 1 then GlobalColor("TrendUp") else GlobalColor("TrendDown")); #SuperTrend
Tsl.SetLineWeight(1);
plot entryArrow = (if Trend == 1 and Trend[1] == -1 then Trend else Double.NaN); #Up Entry Arrow
entryArrow.SetDefaultColor(Color.WHITE);
entryArrow.SetPaintingStrategy(PaintingStrategy.BOOLEAN_ARROW_UP);
entryarrow.sethiding(!entryarrows);
plot exitArrow = (if Trend == -1 and Trend[1] == 1 then Trend else Double.NaN); #Down Entry Arrow
exitArrow.SetDefaultColor(Color.YELLOW);
exitArrow.SetPaintingStrategy(PaintingStrategy.BOOLEAN_ARROW_DOWN);
exitArrow.sethiding(!entryarrows);
#========================== End SuperTrend 2016 ===========================#
input horizontal_line_limiter = 1;
def dataCount = CompoundValue(1, if !IsNaN(entryArrow) or !IsNaN(exitArrow)
then dataCount[1] + 1
                                         else dataCount[1], 0);
def  HUp   = if HighestAll(dataCount) - dataCount <= horizontal_line_limiter - 1
             then if Trend == 1 and Trend[1] == -1 then high else HUp[1] else Double.NaN;
def HDn    = if HighestAll(dataCount) - dataCount <= horizontal_line_limiter - 1 and Trend == -1 and Trend[1] == 1 then low else HDn[1];
plot Hupup = if Hup == 1 then High else double.nan;
input Horizontal = 3;
input Vertical = 0;
def X_h = Horizontal;
def Y_v = Vertical;
def X_h1 = X_h + 1;
input bubbledecimal = 2;

AddChartBubble(showlocationbubble and IsNaN(close[X_h]) and !IsNaN(close[X_h1]), close[X_h1] + TickSize() * Y_v,  "ST: " + round(TSL[X_h1],2), if trend[X_h1] == 1 then Color.GREEN else Color.PINK, no);#if Trend[X_h1] == -1 then Color.MAGENTA else Color.WHITE, no);
def condsell = if close crosses below TSL then 1 else double.nan;
input number_bubbles_tobe_displayed = 2;
rec Countsell = CompoundValue(1, if !isNaN(condsell) then Countsell[1] + 1 else Countsell[1], 0);
def condbuy = if close crosses above TSL then 1 else double.nan;
rec Countbuy = CompoundValue(1, if !isNaN(condbuy) then Countbuy[1] + 1 else Countbuy[1], 0);

input bubblemoversideways = 0;
def bm = bubblemoversideways + 1;
For some reason this is not showing in my chart. What am I doing wrong?
 
Heikin Ashi concept is very interesting . In essence its 2 period smoothing of price action, which visually represents what actually happens in trend better than individual candles. However it can be misleading when used in some timeframes. Back to your question. There is this study I made while playing with HKA - it color candles pink when there is HKA trend transition. It can be used both on regular and HKA charts

Code:
#HK
#Use bar to figure trendDown or confirm.
#heikin ashi bars. close=OHLC/4.  open=1/2(open[1]+close[1])  and HA trend
#
def haclose = (open + high + low + close) / 4;
def haopen = CompoundValue(1, (haopen[1] + haclose[1]) / 2, (open[1] + close[1]) / 2);
def hahigh=max(open,max(close,high));def halow=min(open,min(close,high));

def HAtrendUP  = haclose > haclose[1];
def upBar = if HAtrendUP then upBar[1] + 1 else 0;
def HATrendDown = haclose <= haclose[1];
def downBar = if HATrendDown then downBar[1] + 1 else 0;
def bars = upBar + downBar;
#the one with body small relative to wicks . let say less than 0.3
def HAtransition=absvalue((haopen-haclose)/(hahigh-halow))<0.3;
def HARed = HAOpen > HAclose;
def HAGreen = !HARed;
def HADecidedRed = HARed and HAHigh == HAopen;
def HADecidedGreen = HAGreen and HAlow == HAOpen;

plot data=0;
#
AssignPriceColor( if hatransition then color.MAGENTA
    else Color.CURRENT);
anyway to scan for this?
 
anyway to scan for this?
Heiken Ashi Transition Scan
Shared Scan Link: http://tos.mx/UPqddCS Click here for --> Easiest way to load shared links
ZNz44D1.png

Ruby:
#HK SCAN ONLY
#Use bar to figure trendDown or confirm.
#heikin ashi bars. close=OHLC/4.  open=1/2(open[1]+close[1])  and HA trend
#
def haclose = (open + high + low + close) / 4;
def haopen = CompoundValue(1, (haopen[1] + haclose[1]) / 2, (open[1] + close[1]) / 2);
def hahigh=max(open,max(close,high));def halow=min(open,min(close,high));

def HAtrendUP  = haclose > haclose[1];
def upBar = if HAtrendUP then upBar[1] + 1 else 0;
def HATrendDown = haclose <= haclose[1];
def downBar = if HATrendDown then downBar[1] + 1 else 0;
def bars = upBar + downBar;
#the one with body small relative to wicks . let say less than 0.3
def HAtransition=absvalue((haopen-haclose)/(hahigh-halow))<0.3;

plot scan =  hatransition;
 

Similar threads

Not the exact question you're looking for?

Start a new thread and receive assistance from our community.

87k+ Posts
270 Online
Create Post

Similar threads

Similar threads

The Market Trading Game Changer

Join 2,500+ subscribers inside the useThinkScript VIP Membership Club
  • Exclusive indicators
  • Proven strategies & setups
  • Private Discord community
  • ‘Buy The Dip’ signal alerts
  • Exclusive members-only content
  • Add-ons and resources
  • 1 full year of unlimited support

Frequently Asked Questions

What is useThinkScript?

useThinkScript is the #1 community of stock market investors using indicators and other tools to power their trading strategies. Traders of all skill levels use our forums to learn about scripting and indicators, help each other, and discover new ways to gain an edge in the markets.

How do I get started?

We get it. Our forum can be intimidating, if not overwhelming. With thousands of topics, tens of thousands of posts, our community has created an incredibly deep knowledge base for stock traders. No one can ever exhaust every resource provided on our site.

If you are new, or just looking for guidance, here are some helpful links to get you started.

What are the benefits of VIP Membership?
VIP members get exclusive access to these proven and tested premium indicators: Buy the Dip, Advanced Market Moves 2.0, Take Profit, and Volatility Trading Range. In addition, VIP members get access to over 50 VIP-only custom indicators, add-ons, and strategies, private VIP-only forums, private Discord channel to discuss trades and strategies in real-time, customer support, trade alerts, and much more. Learn all about VIP membership here.
How can I access the premium indicators?
To access the premium indicators, which are plug and play ready, sign up for VIP membership here.
Back
Top