Can someone please assist me in what I have wrong here. I have FOLD used for 2 different formulas.
The FIRST one works halfway and the SECOND one works perfect.
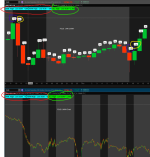
FIRST FOLD Formula - Captures 1 Hour TF (High - Low) for specific period in time defined with SecondsTillTime / it Works on 1-hour Chart BUT Not on a Lower Time Frame chart.
SECOND FOLD Formula - Captures the SUM of ALL (High - Low) for the "Lookback" length. This works perfect on 1 Hour time frame and also works perfect on the lower time frame based off the 1-hour data.
What i am trying to accomplish is the FIRST FOLD where it captures 1-hour time frame (High - Low) for a specific period in time defined by SecondsTillTime on a lower time frame. The FIRST FOLD Formula captures it on the higher TF but not lower. I am looking to capture it on a lower TF as well.
*The SECOND FOLD Formula was to just confirm that it is possible to capture FOLD data from higher TF on a lower TF.
FOLD is a difficult one to master, but I am learning through trial and error along with the much-appreciated help on this forum!
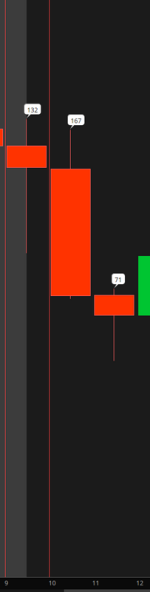
See code along with picture reference below
The FIRST one works halfway and the SECOND one works perfect.
FIRST FOLD Formula - Captures 1 Hour TF (High - Low) for specific period in time defined with SecondsTillTime / it Works on 1-hour Chart BUT Not on a Lower Time Frame chart.
SECOND FOLD Formula - Captures the SUM of ALL (High - Low) for the "Lookback" length. This works perfect on 1 Hour time frame and also works perfect on the lower time frame based off the 1-hour data.
What i am trying to accomplish is the FIRST FOLD where it captures 1-hour time frame (High - Low) for a specific period in time defined by SecondsTillTime on a lower time frame. The FIRST FOLD Formula captures it on the higher TF but not lower. I am looking to capture it on a lower TF as well.
*The SECOND FOLD Formula was to just confirm that it is possible to capture FOLD data from higher TF on a lower TF.
FOLD is a difficult one to master, but I am learning through trial and error along with the much-appreciated help on this forum!
See code along with picture reference below
Ruby:
#aggregation set to HOUR for FOLD High - Low
def H     = High(period=aggregationPeriod.HOUR);
def L     = Low (period=aggregationPeriod.HOUR);
def Close = Close(period=aggregationPeriod.HOUR);

# High - Low
def HL = H-L;

# Candle Lookback period
def LookBack = 30 ;

# Used For First FOLD
def Time_Frame_9AM_HL  =  if SecondsTillTime(900)  <= 0 and SecondsTillTime(1000) > 0  then HL else 0;
def Time_Frame_10AM_HL =  if SecondsTillTime(1000) <= 0 and SecondsTillTime(1100) > 0  then HL else 0;


# FIRST FOLD Captures 1 Hour TF High - Low / it Works on 1 Hour Chart but Not on Lower Time Frames
def SUM_Time_Frame_9AM   = fold a = 0 to LookBack with  b do b + GetValue(Time_Frame_9AM_HL,  a );
def SUM_Time_Frame_10AM  = fold c = 0 to LookBack with  d do d + GetValue(Time_Frame_10AM_HL, c );

addLabel(1, "9AM  High - Low SUM   = "  + round(SUM_Time_Frame_9AM  ,0), color.CYAN);
addLabel(1, "10AM High - Low SUM   = "  + round(SUM_Time_Frame_10AM ,0), color.CYAN);


# SECOND Fold Captures the SUM of ALL High Low for the "Lookback" length
def High_Low_Sum_All = fold g = 0 to LookBack with j do j + If(GetValue(Close <> Close[1], g), GetValue(HL, g), 0);
addLabel(1, "ALL High - Low SUM = "  + round(High_Low_Sum_All,0), color.green);