I am trying to plot the Z score of the true range as a percentile. In order to do that, at each bar I need to fold through my sample period and count how many Z-Score values are lower than my current bars Z score value. If all Z-Score values in the sample period are lower the output will be 1.0. My issue is with getting the counting logic utilizing the fold function right. I can't quite seem to get it.
Ruby:
input Length = 10;
#Calculating volitility Z-Score, true range used as volitility metric
def TrueRange = TrueRange(high, close, low); #Observed value
def TR_Average = Average(TrueRange, Length); #Mean of sample
def TR_StDev = StDev(TrueRange, Length); #Standard Deviation of sample
def TR_Z_Score = (TrueRange - TR_Average) / TR_StDev;
def TR_Z_Percent_Count =
fold i = 0
to Length
with S = 0
do if (TR_Z_Score > getValue(TR_Z_Score, i, Length))
then TR_Z_Percent_Count[1] + 1
else TR_Z_Percent_Count[1];
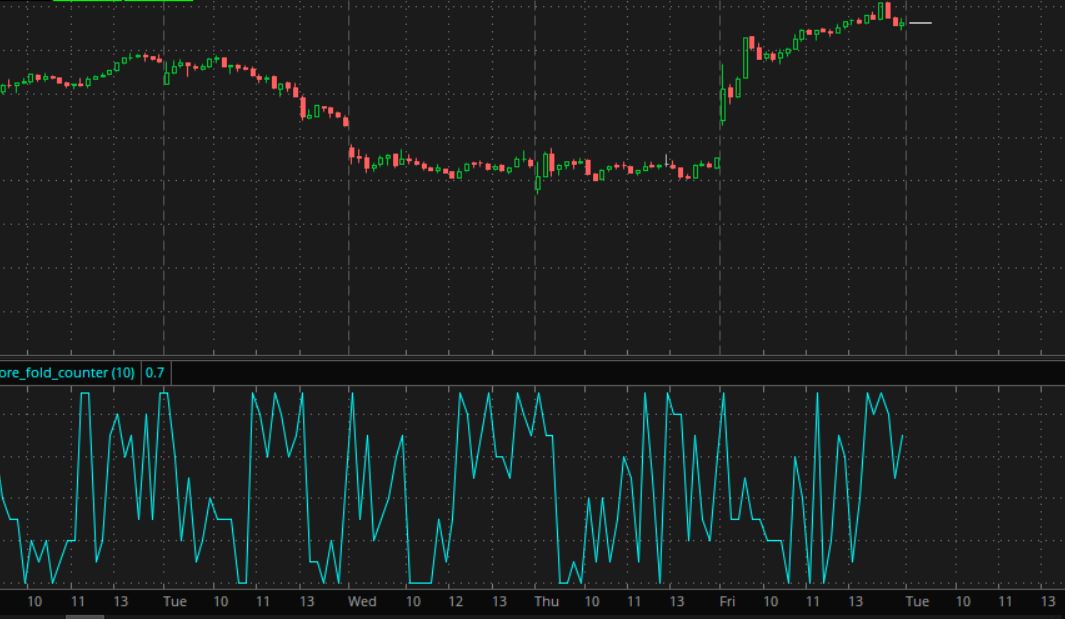
def TR_Percentile = TR_Z_Percent_Count / Length;
plot Data = TR_Percentile;